


General Description
The Penny Ice Cap, unlike its northern neighbour the Barnes Ice Cap,Reference Baird, Ward and Orvig1 is extremely difficult to describe. Both its relief and outline are irregular, the latter can only be compared with a very ruffled cockatoo. Its bounds are also hard to define, since it is partly surrounded by and at times has an ice surface contiguous with nearby small plateau caps and transection glaciers.
Limits have, however, been given arbitrarily as shown in Fig. 1, the most dubious being the two divisions in the extreme south-east. These limits yield an area of about 5900 sq. km. (2300 sq. miles), almost identical with the area of the Barnes. In altitude and variety, however, it is indubitably the superior, resting as it does on the top of a mountain region, with only its western lobe spreading over lower ground.
Map of the limits of the Penny Ice Cap
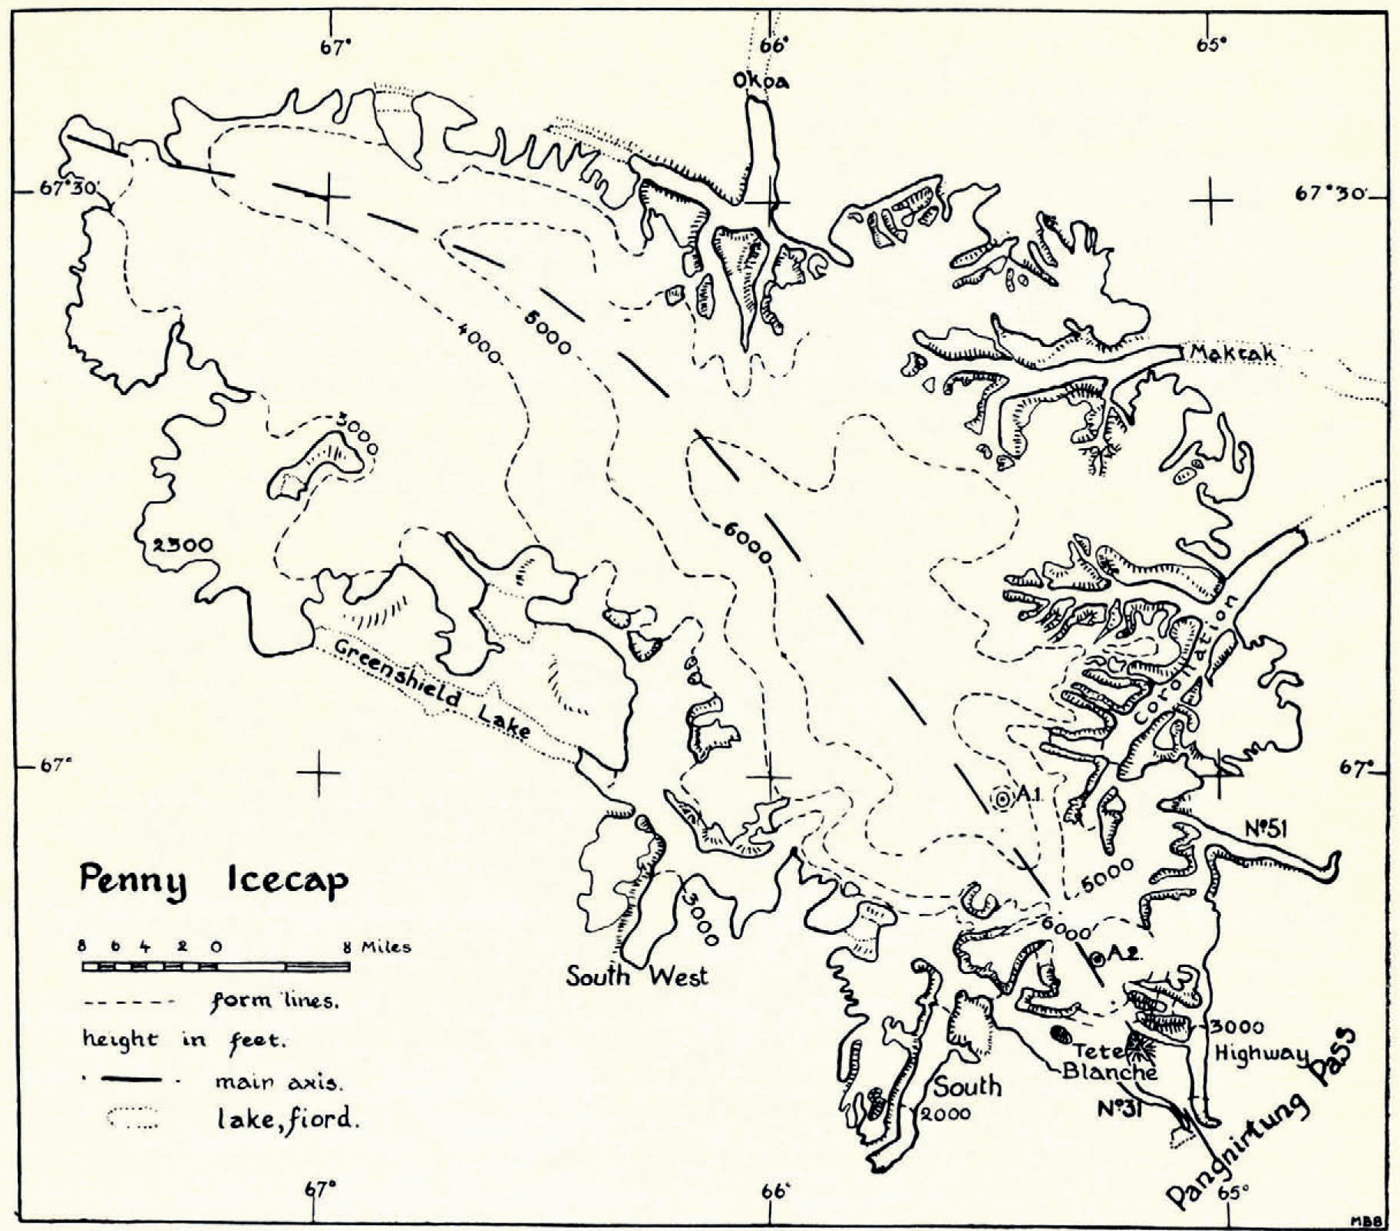
This mountain region, it would be incorrect to call it a chain, is part of the great range which runs from the tip of Cumberland Peninsula to Bylot Island, some 1000 km. in Iength. In the Penny region it is at its greatest height, 6300–6800 ft. (1900–2100 m.) being the mountain level, and the highest peaks have added ice domes, a notable feature, bringing a very few of them over 7000. ft. The arc of high ground starts between the heads of Pangnirtung and Kingnait Fjords, swinging from a northern to a west-north-westerly direction. (Another high mountain group lies east of Kingnait, culminating in Mt. Raleigh.)
Pangnirtung Pass, a deep defile, cuts through this arc and it is to the north-west of the pass summit (400 m.) that the Penny Ice Cap proper begins. Its 140 km. long main axis curves from here along the presumed summit of the underlying mountains.
Cutting deeply into the cap are valleys with varying trends. These first appear as gentle depressions in the ice cap, then steep rock faces emerge from beneath the ice intermittently on each side,. and finally the valley becomes a great outflowing glacier flanked by steep continuous rock cliffs 1000 m. or more in height. On top of these the ice cap shows again and feeds small steep valley glaciers laterally into the main streams. Many great outflows can be counted, but ten are of major significance. On the north comes the glacier flowing into Okoa Bay (was this glacier much longer in the 1880’s and did it fill the present-day 24 km. long fjord which Boas, otherwise remarkably reliable, missed from his map ?).
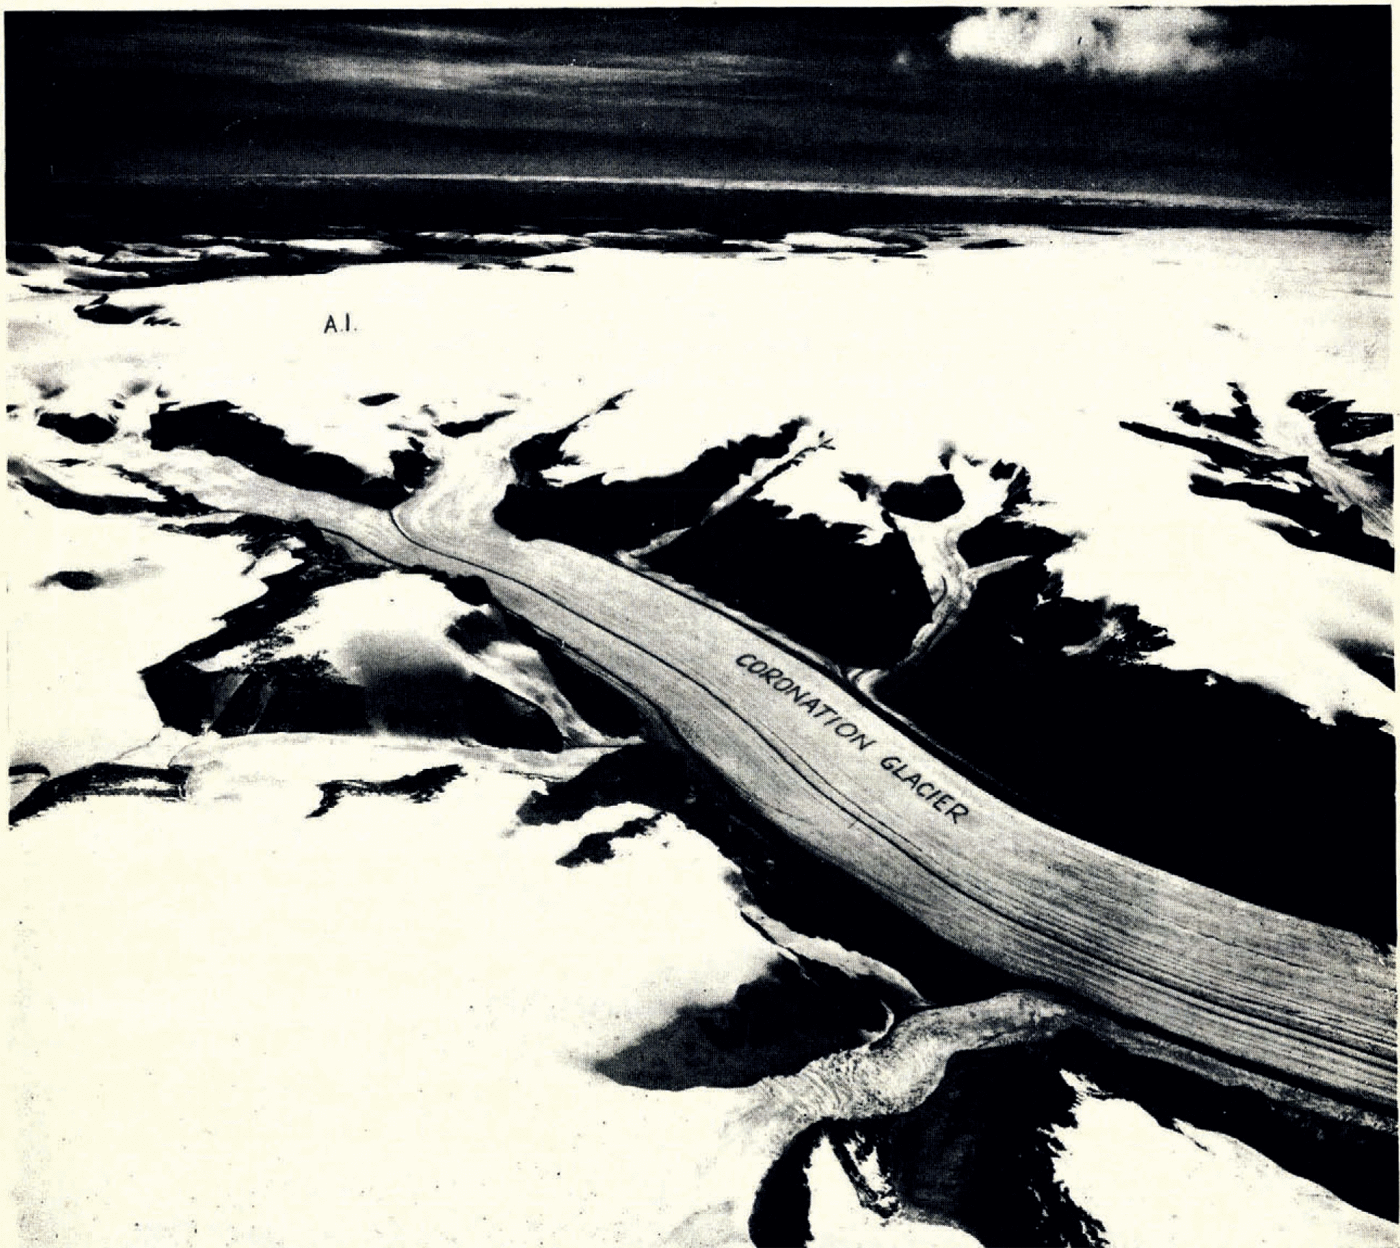
Maktak and Coronation Glaciers, draining north-east, also both reach the heads of fjords. The latter, which has a major western tributary, ends in the sea in a retreating ice cliff. Fig. 4 (p. 344) is a Royal Canadian Air Force photograph of the upper part of Coronation Glacier (about 2 miles wide) with the main ice cap and the site of Camp A1 beyond.
Three main streams come down into Pangnirtung Pass, Highway Glacier and Glaciers No. 51 and 31.
Glacier No. 31 is on a great structural trend which has been fixed as the southern limit of the ice cap. This straight depression trends 300° true from the Pass, can be traced thence for over 110 km., and includes the 28 km. long Greenshield Lake. East of the Pass, after a break, it appears again in the Nakasakjua tributary to Padle River.
Two major ice streams cross this depression, overflowing it as they go. These South and Southwest Glaciers both reach low levels and their melt-water rivers converge to reach Cumberland Sound opposite Kekertelung Island.
Finally there are two main bulges of the western lobe, one damming the west end of Greenshield Lake and reaching a low level of 700 m. on a broad front.
Another striking structural valley fronts the northern part of the ice cap; here from an elevation of 1300 to 1600 m. many small tongues pour down into it, till finally Okoa Glacier swamps and crosses it.
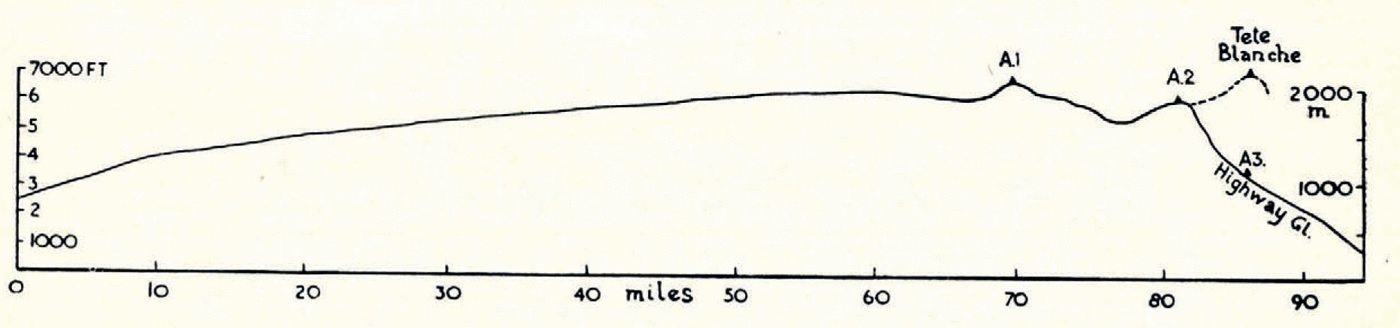
No part of the ice cap, with the exception of a thinly-covered great peak in the extreme south-east (Tête Blanche, see Fig. 3), exceeds 7000 ft. (2130 m.) in altitude. Camp A1, just south of the 67th parallel at 2050 m., was on a noteworthy dome and almost certainly was higher than any part to the north and west, where perhaps two other areas rose nearly to the 2000 m. contour. At point 8, between A1 and the highest domes near Camp A2, was a depression where the col between Coronation and South Glaciers lay at 1610 m. The profile along the main curving axis of the ice cap from the north-west corner to the summit of Pangnirtung Pass, where both Highway Glacier and Glacier No. 31 terminate, is shown in Fig. 2 (p. 343).
Profile along the main axis of the Penny Ice Cap
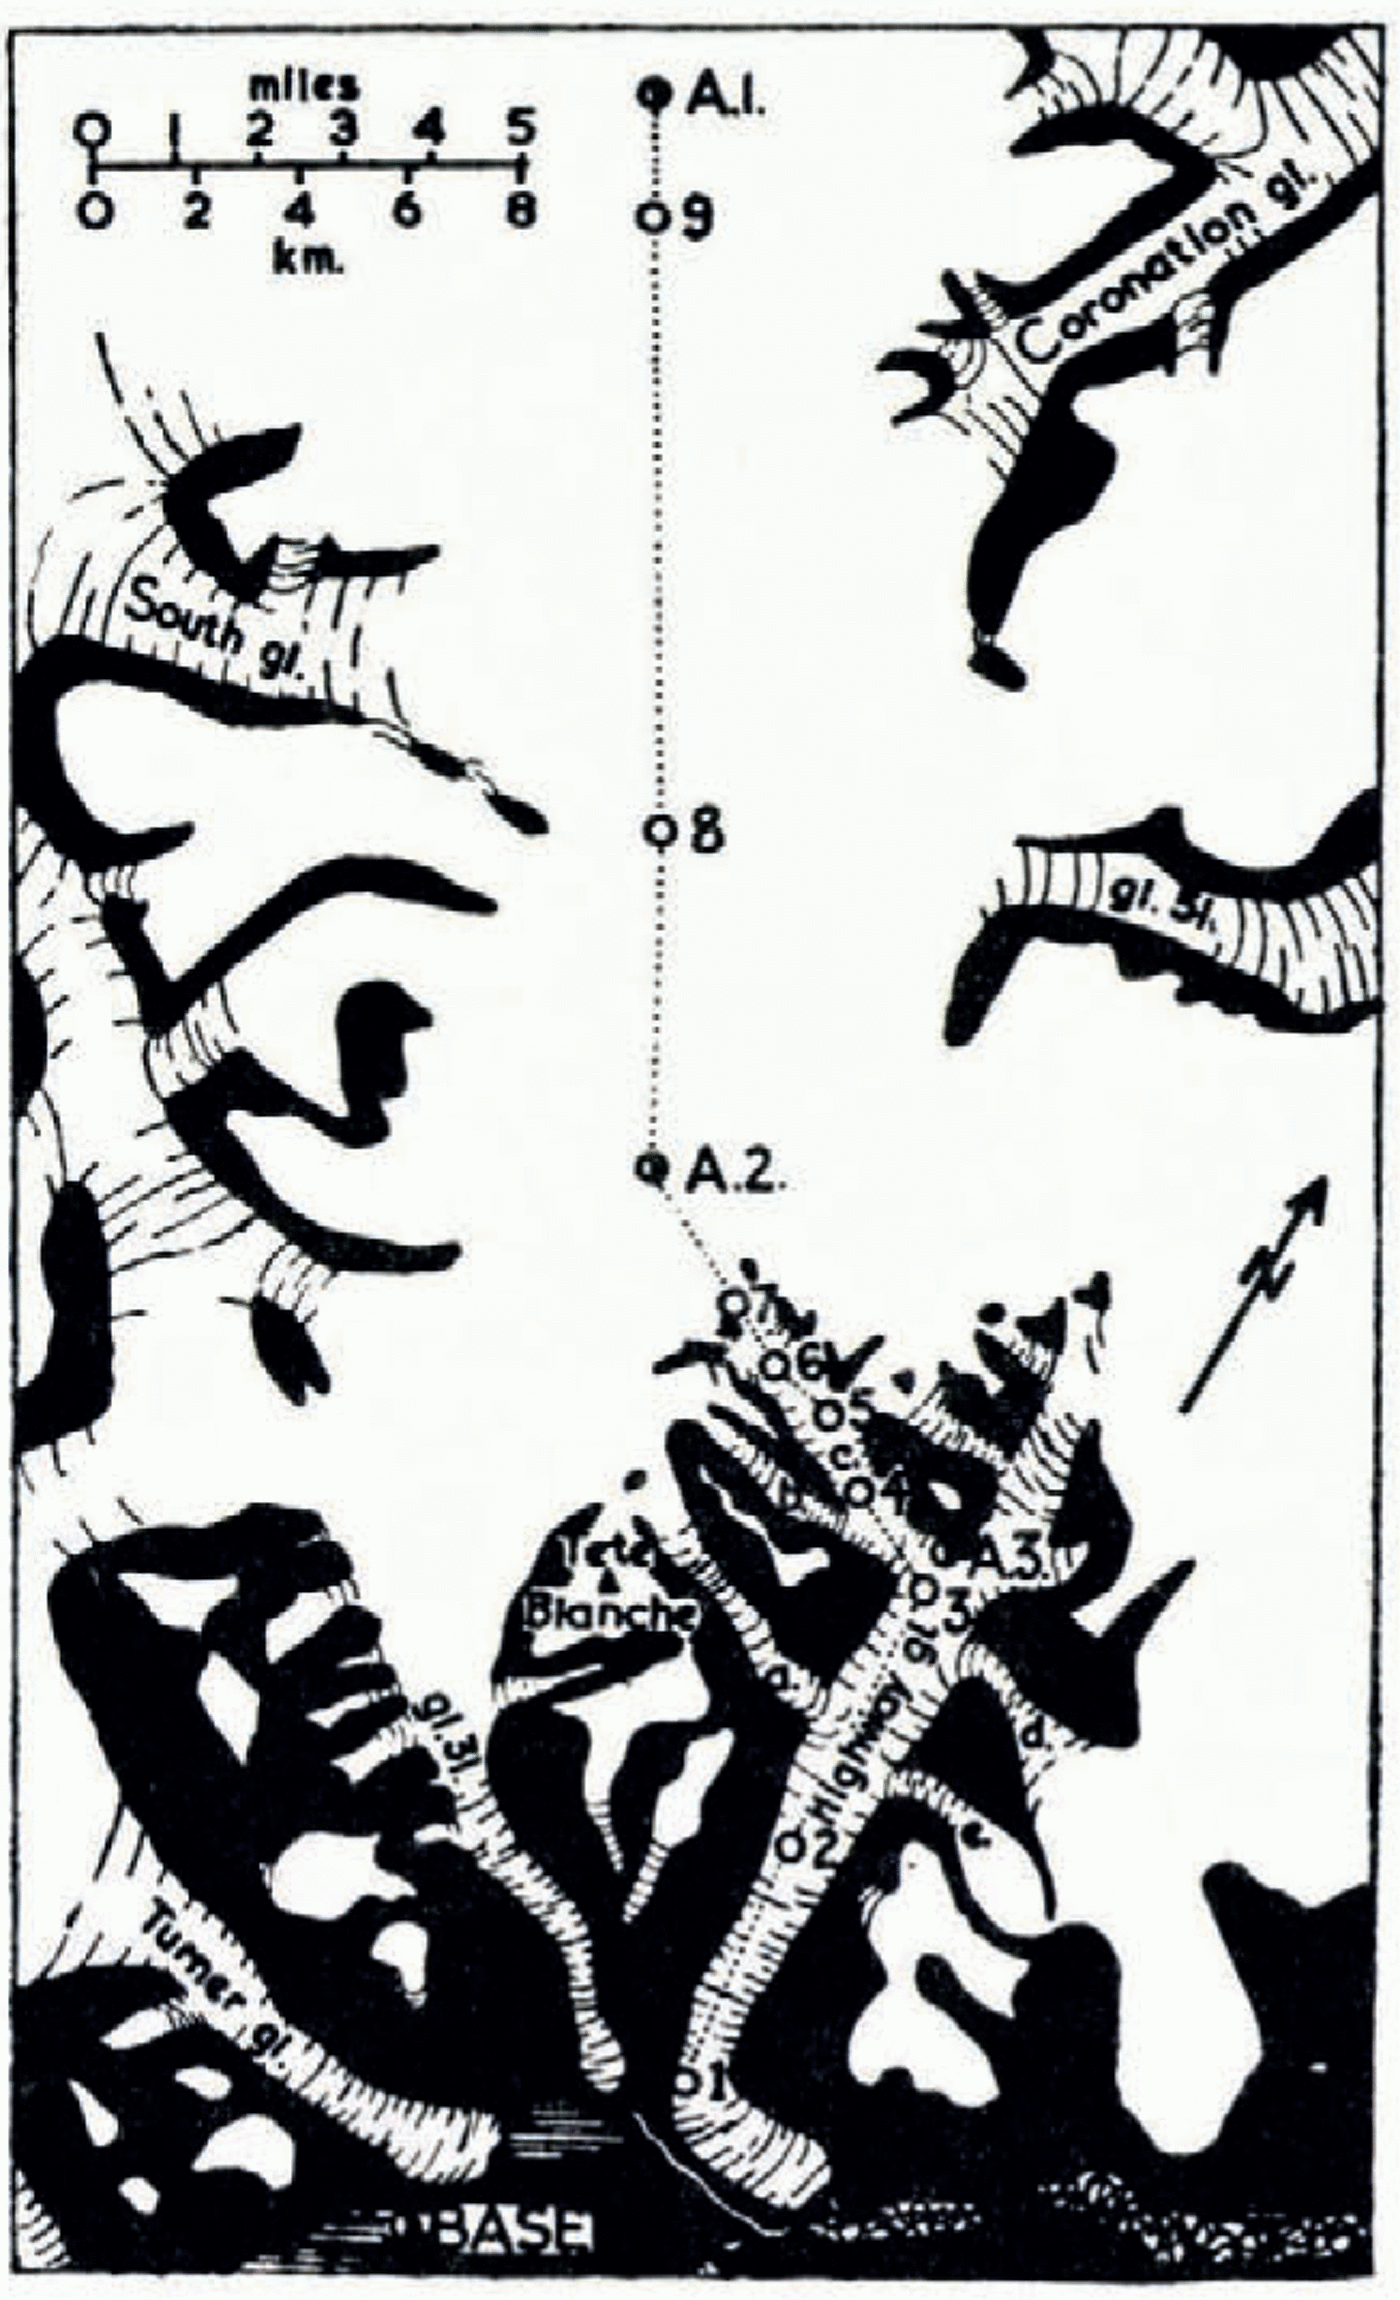
Detailed map of Highway Glacier and the ice cap camps. Exposed rock is shown black
The upper part of Coronation Glacier and the site of Camp A1
Above about 1550 m. the ice cap surface is above the firn line. On the tops the ice is probably nowhere very thick, and only in the cols between the heads of the major valleys and within these is the ice thickness likely to exceed 300 m. Typically the cliffs of the valleys are immediately overhung by a 50 m. ice wall, behind which a smooth dome rises, covering what is probably a plateau-like rock surface.
Visual observations throughout the area by various members of the expedition showed that a general increase in the extent of glaciation at least 150–200 years ago had been followed by a retreat which began about 50 years ago and which is still notably in progress. Vegetation studies giving the moraine chronology will be reported elsewhere by F. H. Schwarzenbach.
A highly dissected plateau would be likely to be revealed if the ice cap vanished; only in the north-west does it appear to surge on to lower ground as once perhaps it surged all over Canada from the ramparts of the whole of this eastern mountain range.
Measurements of Accumulation and Ablation
Along the 40 km. course between Camp A1 and the tongue of Highway Glacier the progress of accumulation and ablation was followed with the object of estimating the total annual accumulation of snow and the total ablation over the entire range of altitude of the ice cap. For this purpose a series of bamboo stakes was established to measure the relative level of the snow surface and pits were dug as frequently as possible to record the snow profile and to measure the varying density of the settled snow.
(a) Stake measurements and the weather
Bamboo stakes were placed in positions 1, 2, 3, A3, 4, 5, 6, 7, A2, 8, 9 and A1 as shown in Fig. 3. The records of the surface level at these stakes, their altitudes and, in the ablation zone, the levels of the glacier ice and of superimposed ice are given in Figs. 5a, 5b and 5c (p. 349).
Snow stake observations between the tongue of Highway Glacier and Camp Ar, also some weather data from Base Camp and Camp Ar. In Fig. 5a, the air temperatures at Base Camp are 5-day means, the black columns in the Base Camp precipitation are snow and the open columns rain. In Fig. 5c (right), the durations of snowfall, rainfall, rime and hoar frost and blowing snow are shown by the widths of the vertical black lines; the air temperature is a 5-day mean
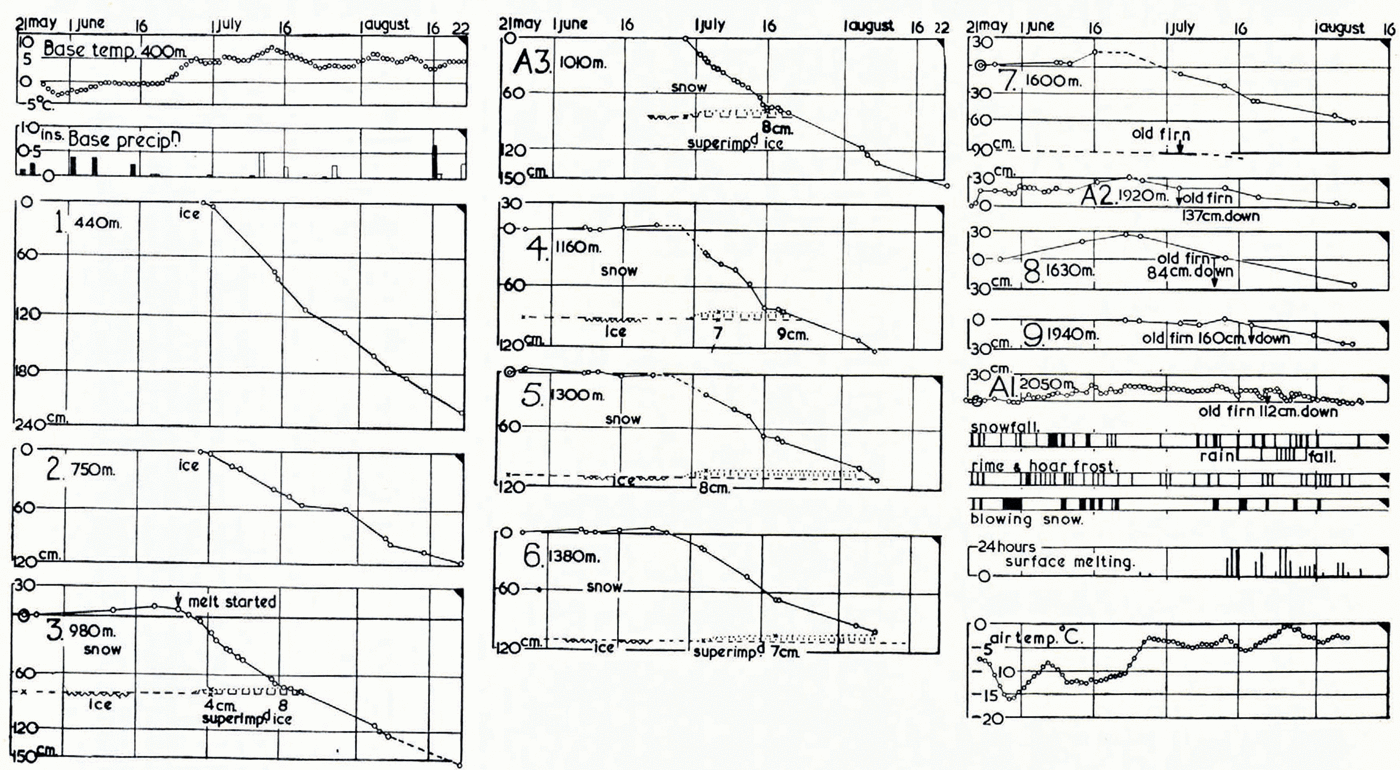
At the top of Fig. 5a and in the lower part of Fig. 5c some of the weather records from Base Camp and Camp AI respectively are given. The complete records will be reported by Svenn Orvig elsewhere.
For Base Camp (400 m.) the 5-day means of screen temperature are given, together with the daily amounts of precipitation (snow or rain) as recorded in a rain gauge. Maximum screen temperatures of 15° C. were reached on 15 July and 5 August, and the daily values were above the freezing point almost the whole time. The minimum daily temperature reached a low of −7° C. on 28 May and remained below freezing until almost the end of June.
For Camp AI in Fig. 5c the duration of snowfalls, rainfalls, of rime and hoar frost formation and of blowing snow is indicated by the width of the short vertical lines. The number of hours per day during which the snow surface was melting is also given, and these data are repeated at the top of Fig. 8 (p. 351) for comparison with the melting revealed in the pits. There was a total of 228 hours of surface melting until 10 August when observations ceased and there were subsequently a few more hours of melting, judging from the snow conditions during ascents of the highest mountain in the Pangnirtung Pass on 25 and 28 August. The air temperature is given in Fig. 5c as 5-day means. The maximum daily screen temperature reached 3.6° C. on 25 July and it was above the freezing point on 25 June, on 10 days during the last fortnight of July and on 3 days early in August. The minimum daily screen temperature reached a low of about —25° C. during a blizzard on 29 May and values just over the freezing point were reached on 24 and 25 July.
The snow and ice surfaces above about 700 m. froze every night whenever the sky was reasonably clear.
Referring again to the stake-measurement diagrams, Fig 5, when Stakes 1 and 2 were installed the snow had quite recently disappeared and they were frozen into holes drilled in the ice. However, soon after the late W. R. B. Battle arrived at Base Camp he reported by radio that about 90 cm. of snow overlaid the ice of the glacier tongues in the vicinity and that it had begun to melt already. This depth of snow compares well with the value at Stakes 3 and A3, and at these and all higher stakes the whole of the annual accumulation is included in the measurements.
At Stake 2 when it was installed there were a few inches of superimposed ice, recognized dubiously by its hexagonal candle-like structure normal to the surface, but no reliable figure can be given. The surface was irregular at the time and, in the absence of a reference before the spring melt commences, there is no possibility of distinguishing current superimposed ice from the late autumn variety or from shallow pools frozen in the autumn.
At Stakes 3, A3, 4, 5 and 6 a maximum thickness of about 8 cm. of superimposed ice was formed and was remelted later in the summer. It was possible to make measurements of superimposed ice at these stakes because they were thrust down to the existing ice surface by Röthlisberger towards the end of May before melting started. Later they were excavated and the build-up of new ice around their lower ends was measured. The stakes were then reset nearby by drilling them into the underlying ice to a safe depth and the final thickness of superimposed ice was obtained when it appeared near the surface and the snow had practically gone.
(b) Snow pits
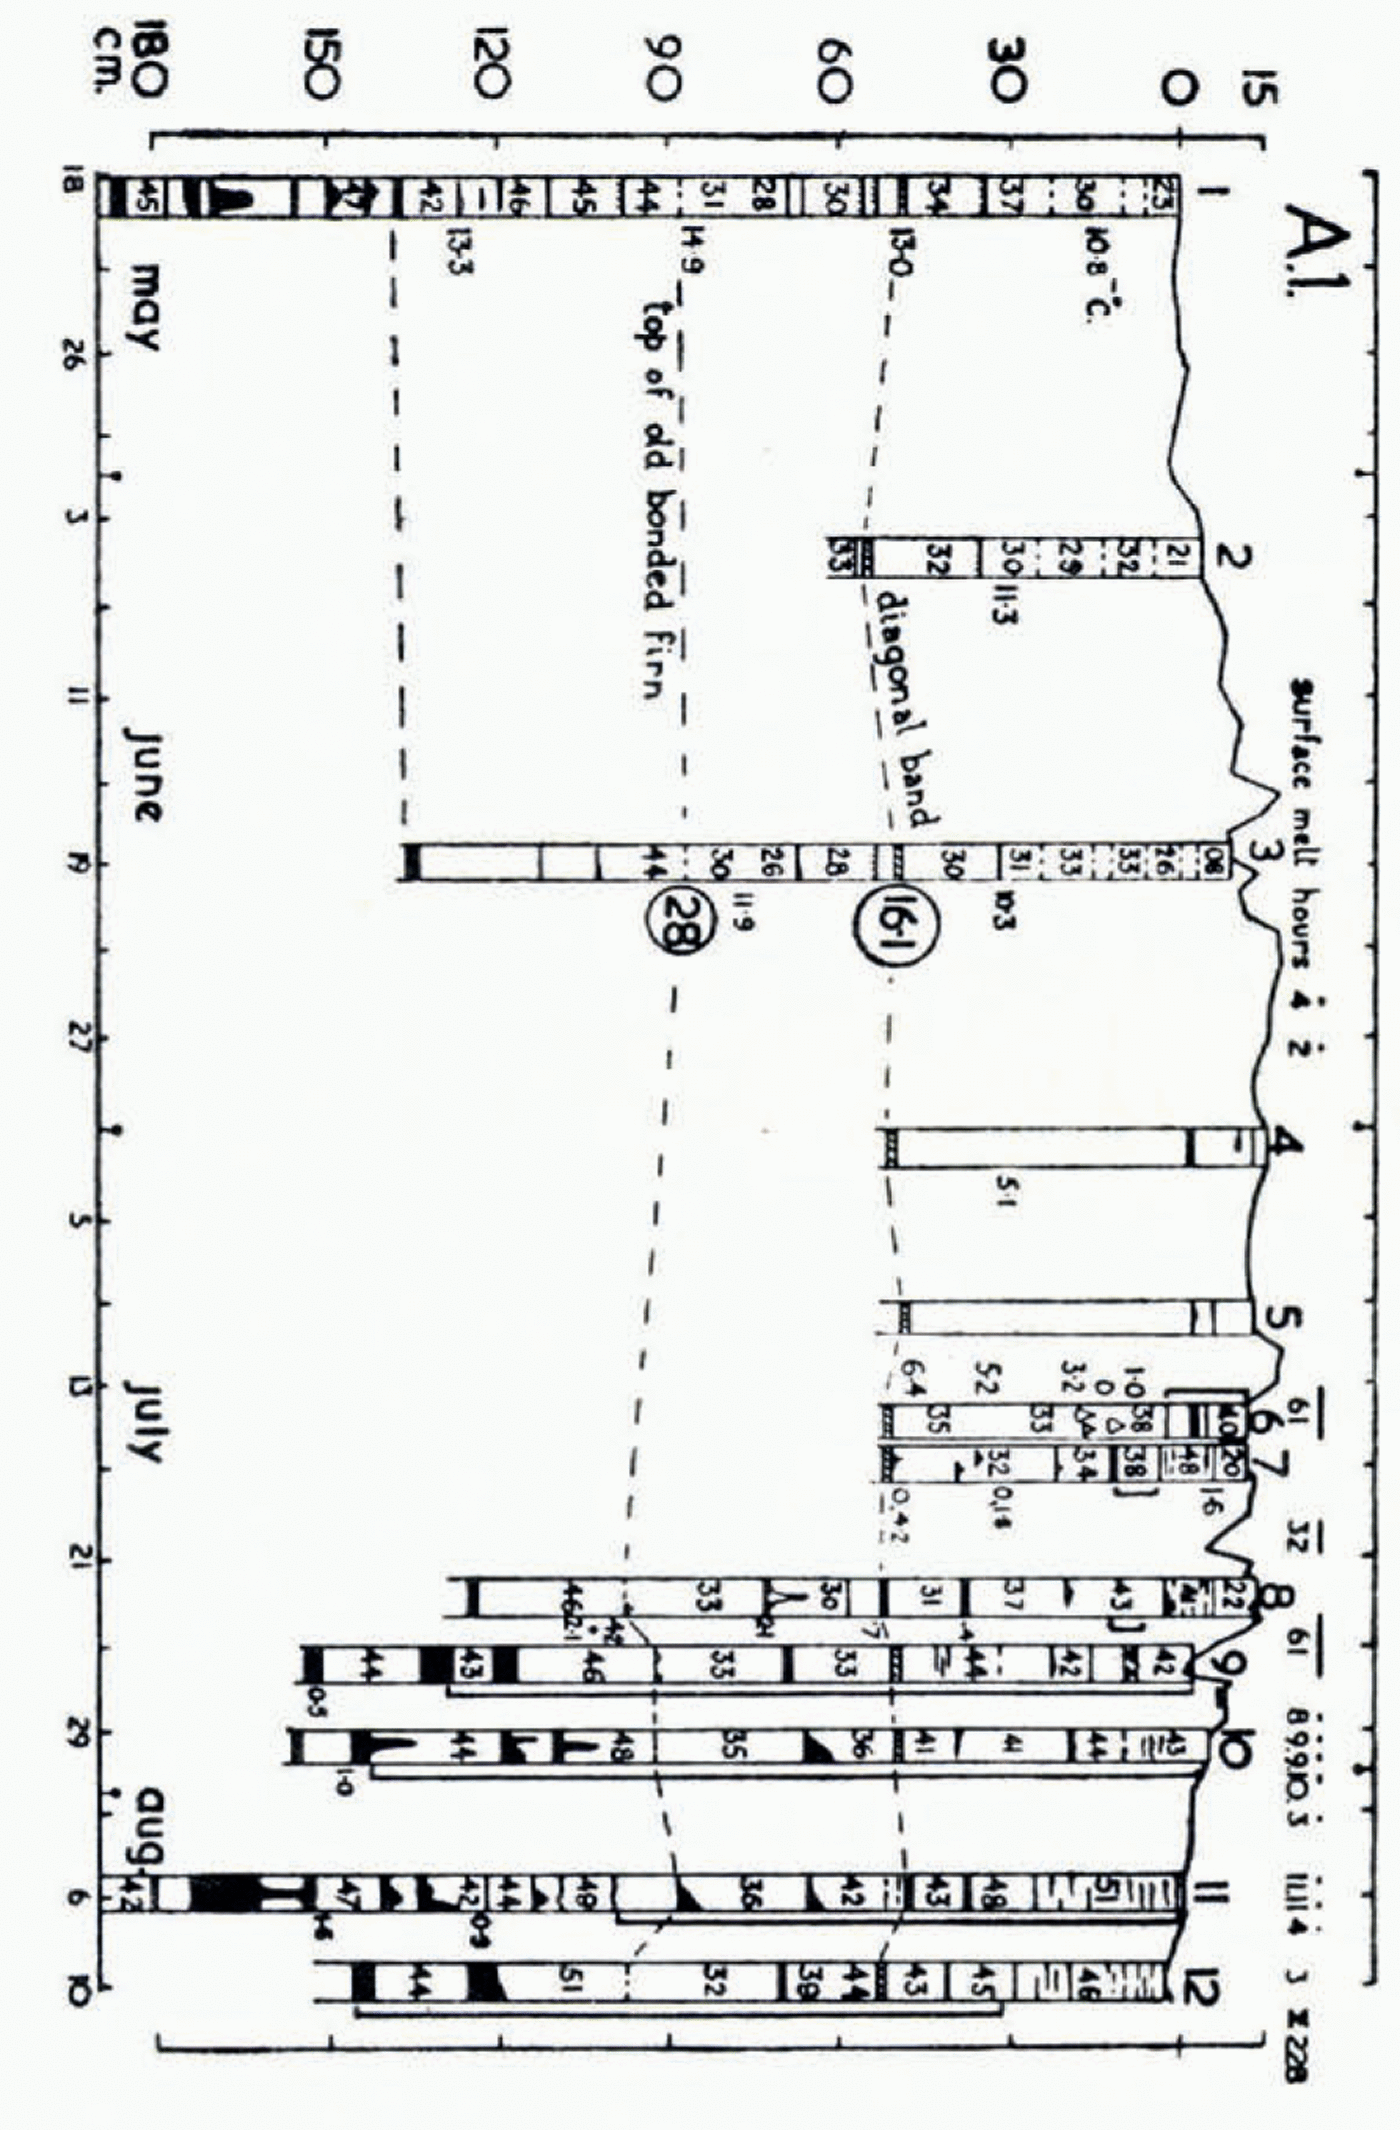
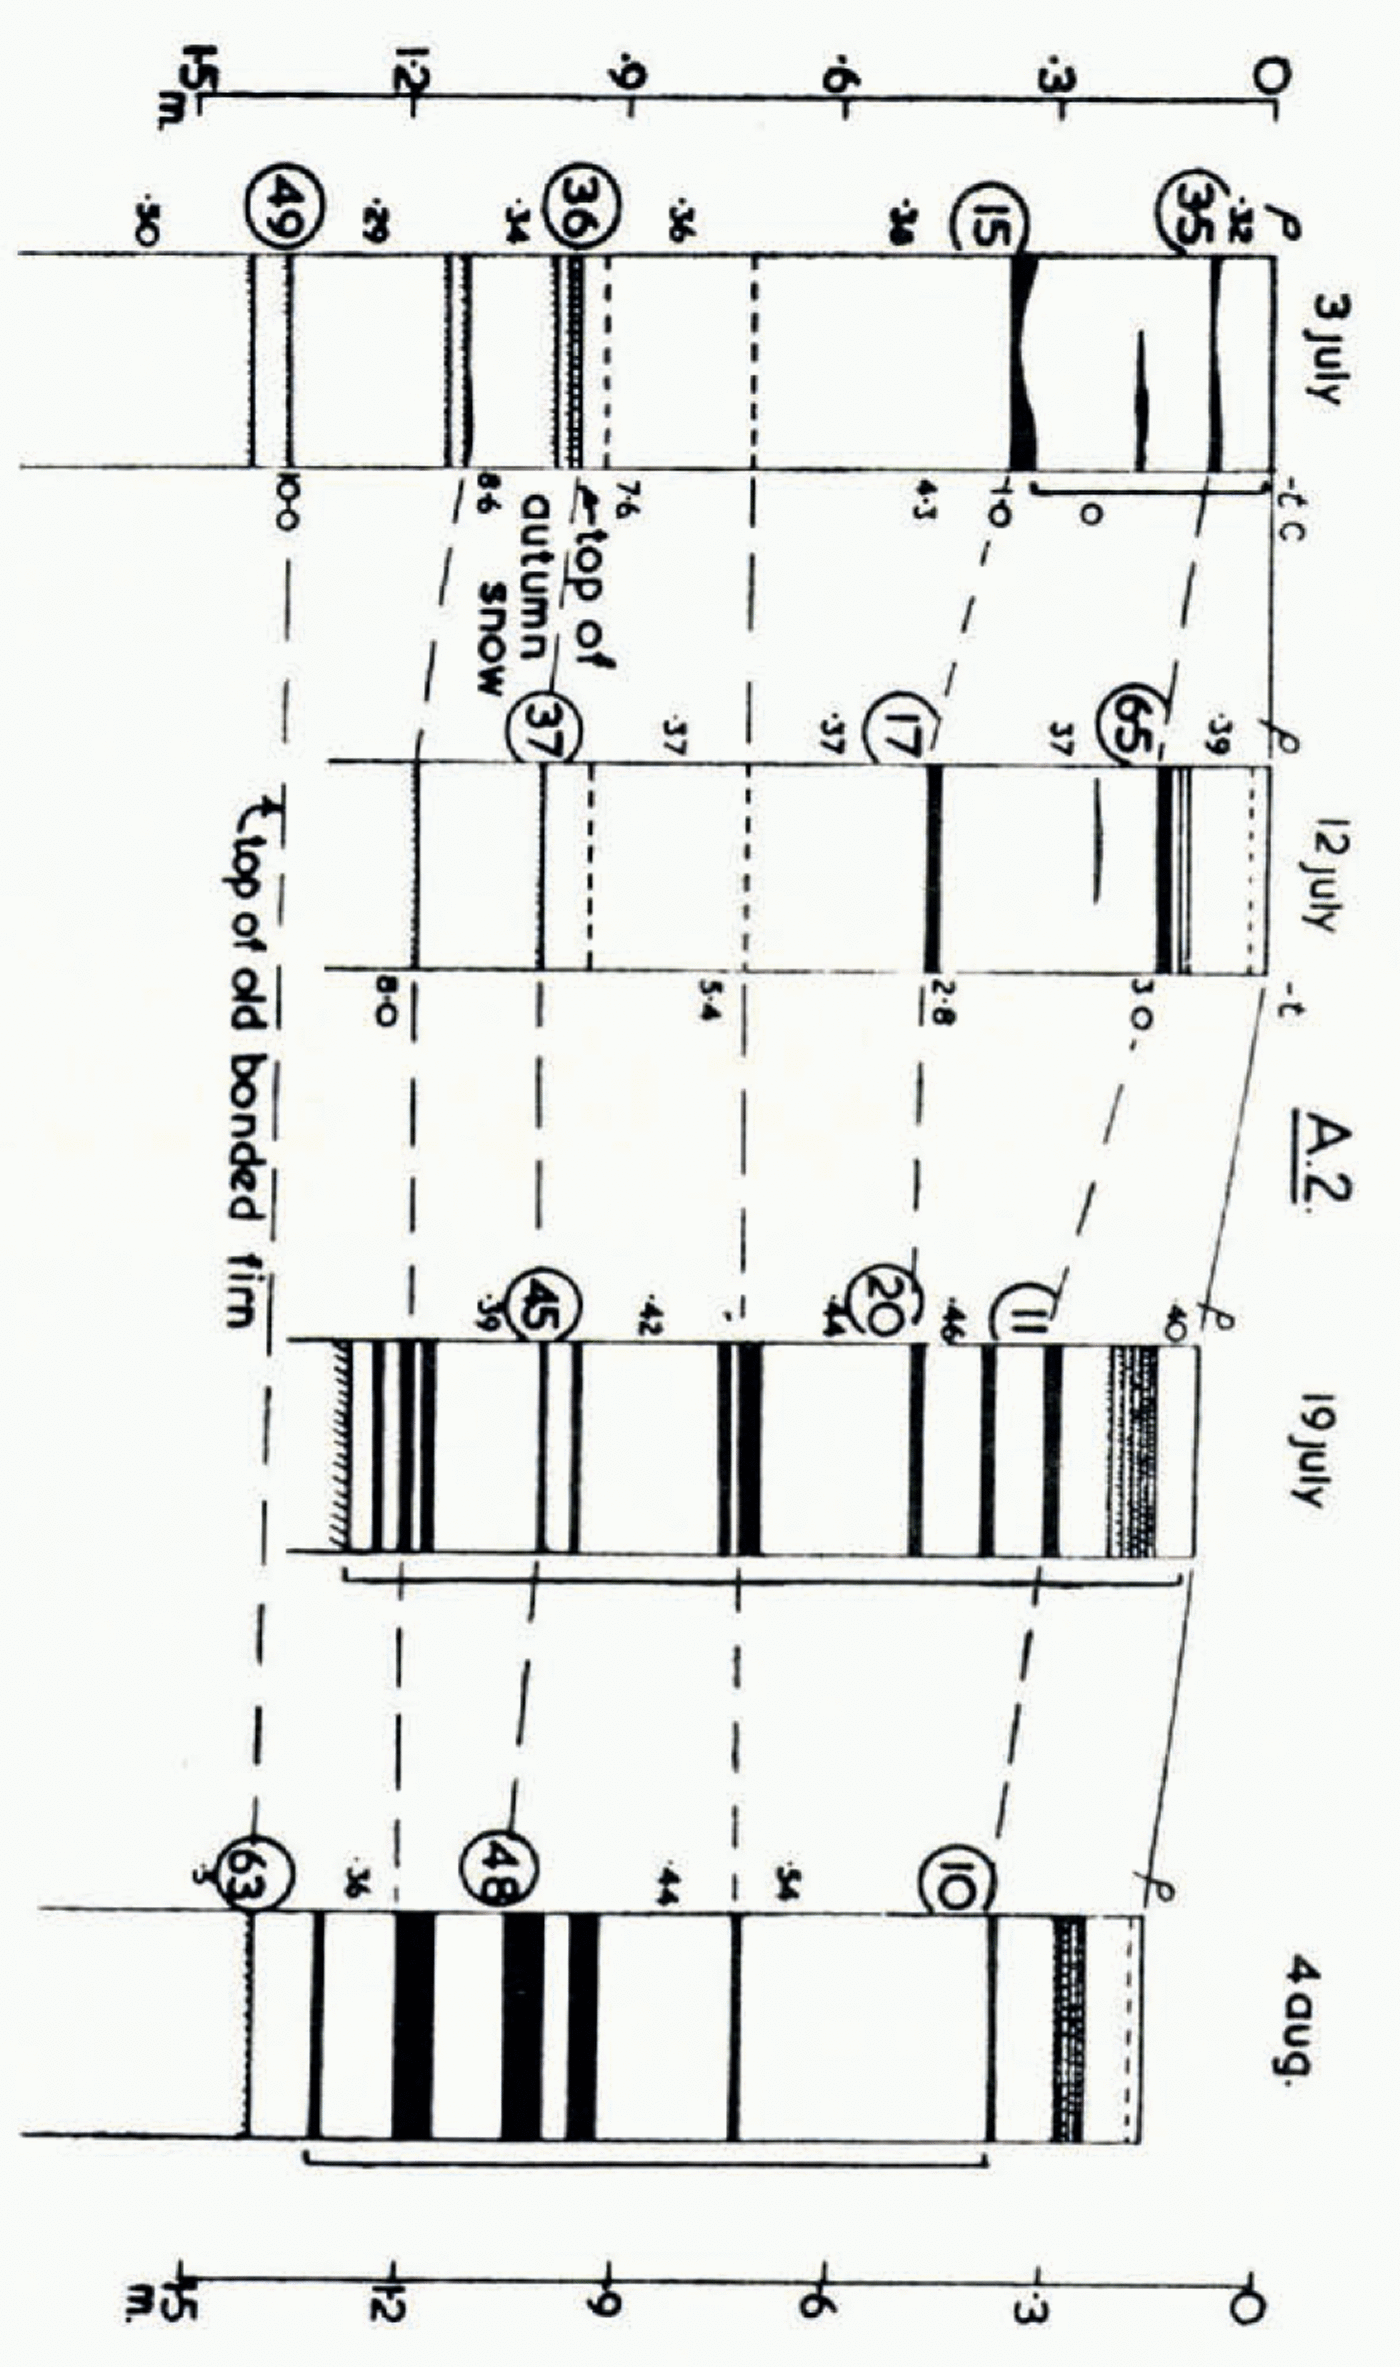
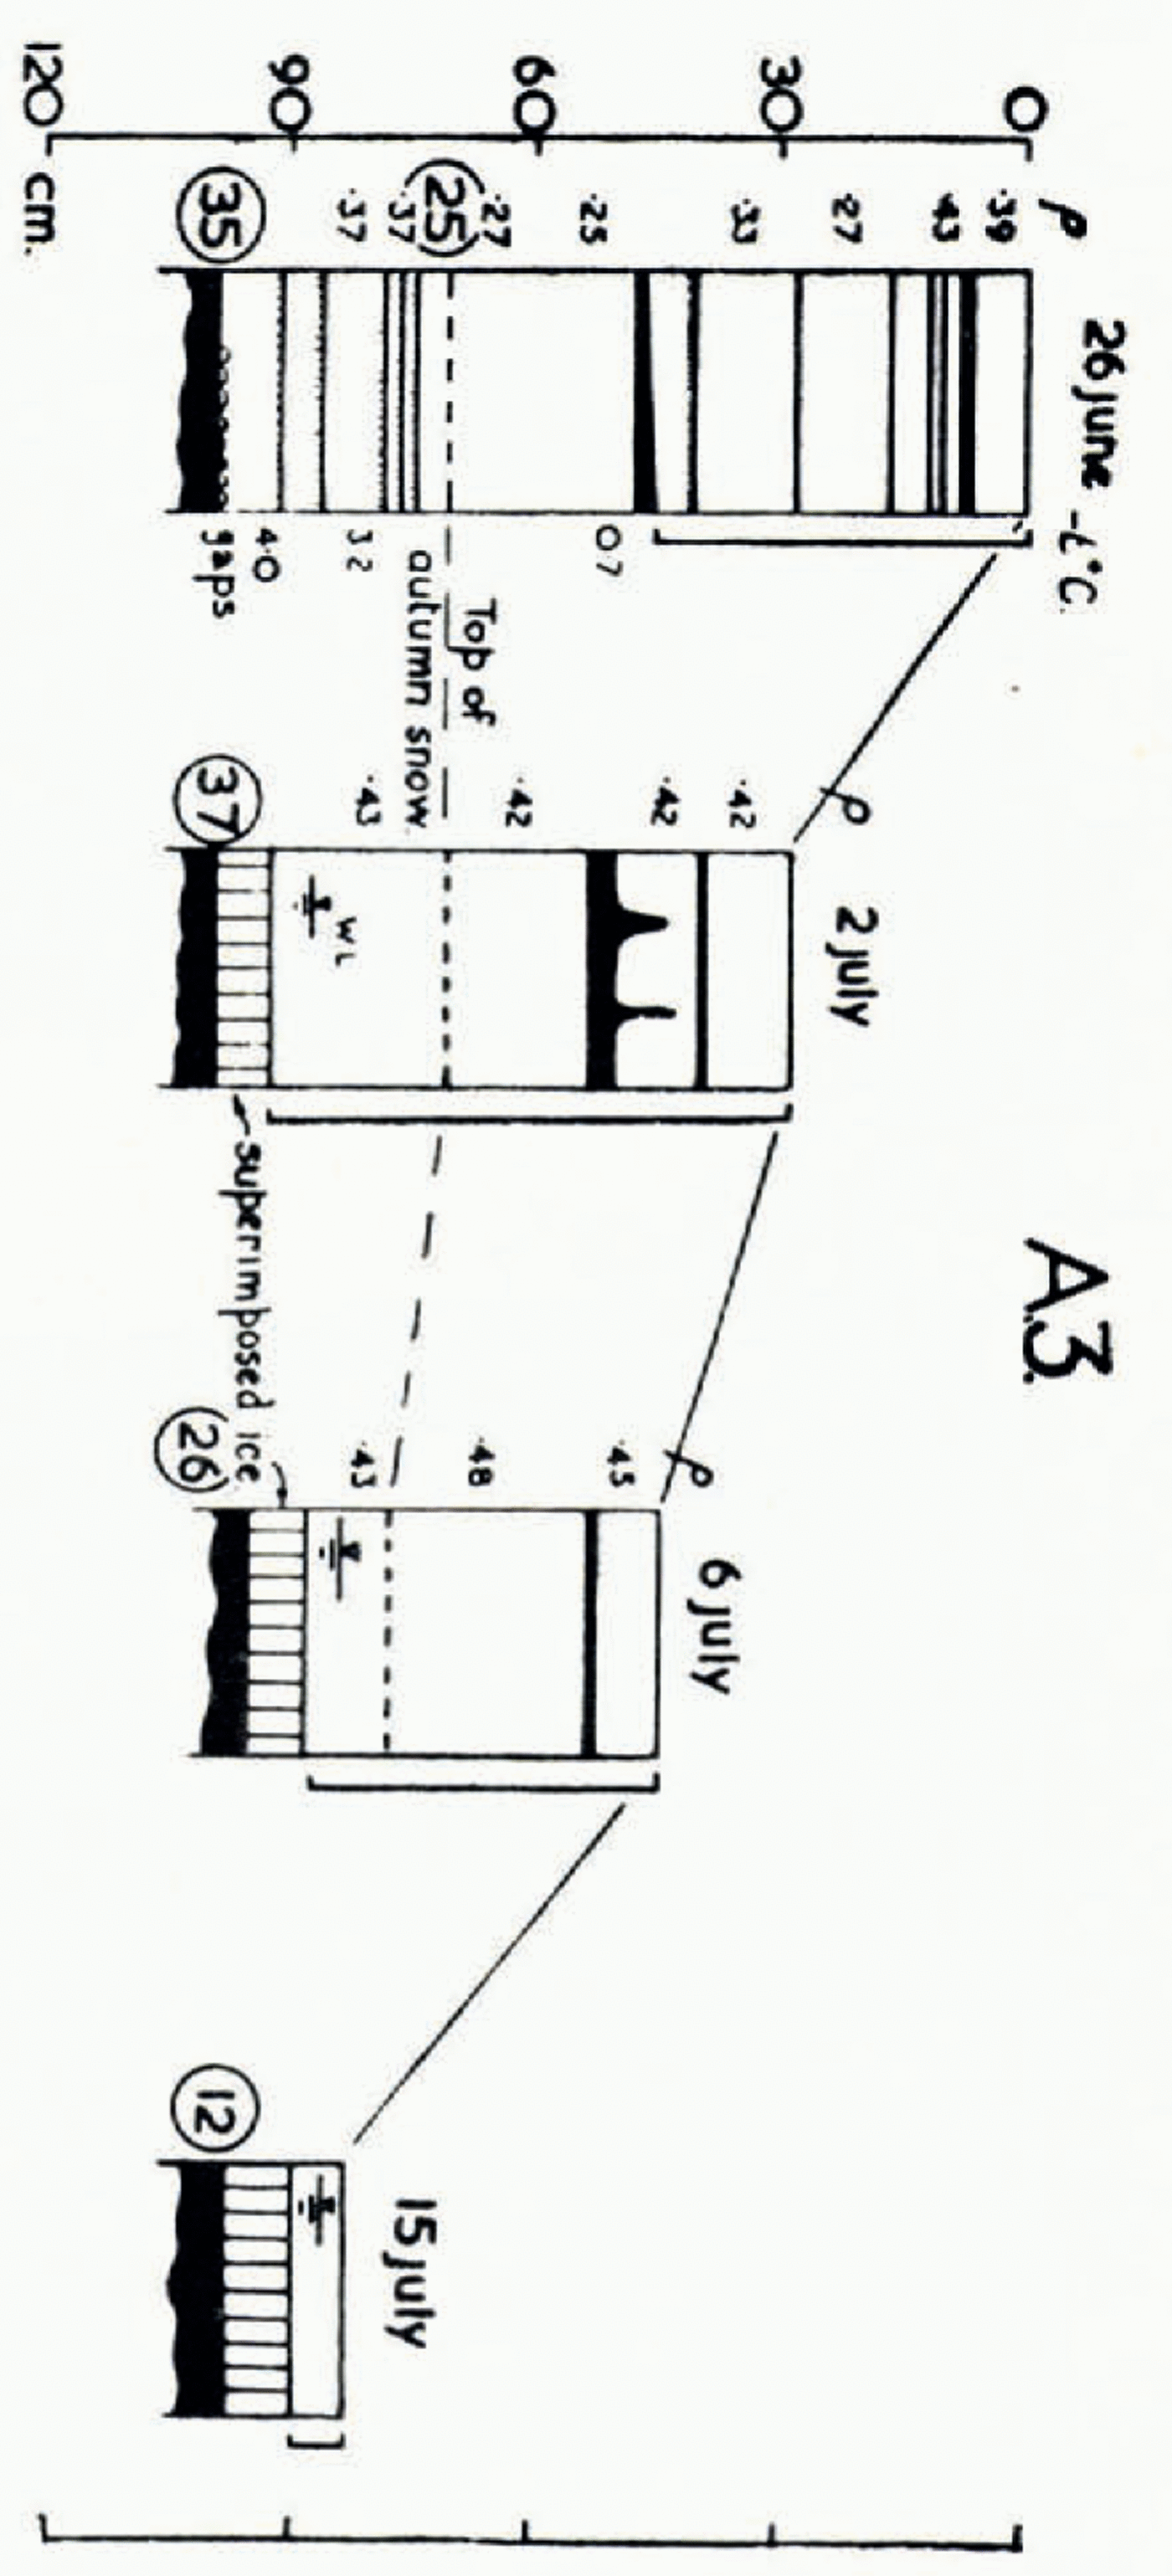
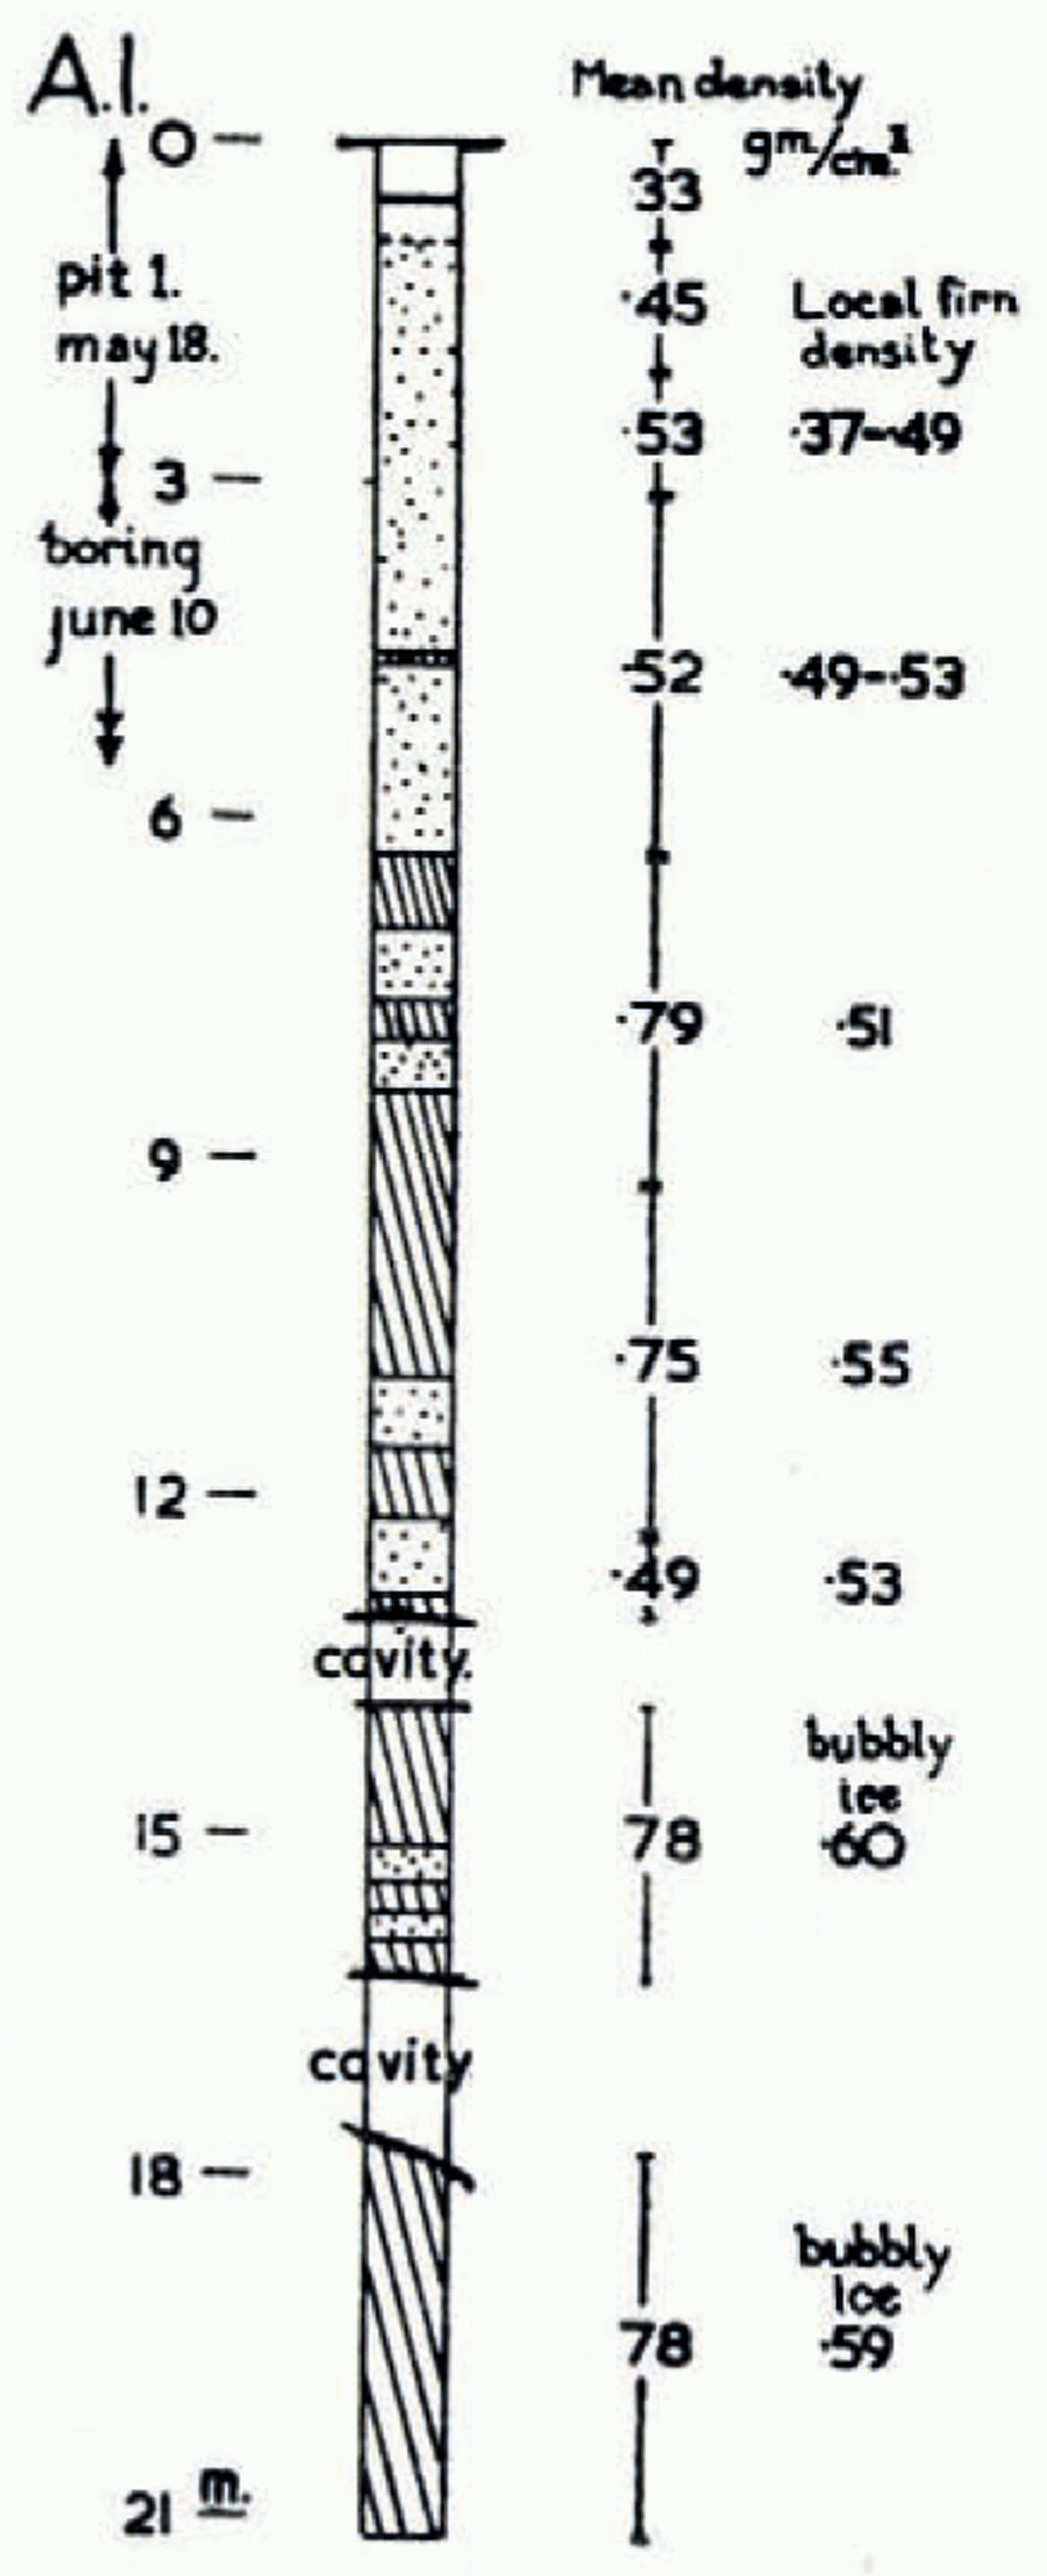
Many snow pits were dug along the course to record the succession and type of snow and the ice layers as they changed through the season. Some of the data at the camp sites A3, A2 and A1 are given in Figs. 6, 7 and 8 (p. 351), and the record of a 21 m. boring at Camp A1 is shown in Fig. 9 (p. 347). In these diagrams the snow characteristics have been omitted for clarity, and only the position and thickness of snow and ice layers, their densities and temperatures are given. Broadly speaking the character and succession of the snow layers were the same at all altitudes, as were the changes that occurred during melting.
Snow profiles at Camp A3 down to the ice. Dense ice bands are black; icy crusts have nicks beneath the line; the junction between one snow layer and another is a dotted line; the melting zone is shown by a vertical line to the right of each profile and the large ringed figures to the left are the water equivalents (cm.) of the snow above. Temperatures are negative Centigrade, densities in gm./cm 3
Snow profiles at Camp A2 down to the old firn. The symbols are as for Fig. 6
Snow profiles at Camp A1. Symbols as for Fig. 6, except that densities are inside columns and temperatures outside, water equivalents in only one profile
Density profile in boring at Camp A1 (see page 348)
(c) The settled snow and firn
The general deep profile in the firn zone can be seen in . The mean densities in this boring were obtained from the weights of total extracted material at intervals of depth and a knowledge of the diameter of the bored hole. The local firn densities were obtained by weighing short intact cores, 10–40 cm. long.
The current settled snow with a mean density of 0.33 gm./cm.3 is about a metre or more thick. Beneath, to a depth around 6 m., is the typical firn of the region. It is a strongly-cemented coarse dense firn (shown dotted in Fig. 9, but elsewhere shown by its ice layers) and contains frequent layers, lenses and glands of dense ice, often 3–8 cm. thick. The mean density of this zone is about 0.5; it requires a pick for excavation.
From about 6 to 13 m. below the-surface there is distinctly less firn and much more dense ice, and the mean density rises to 0.75 gm./cm.3 or more.
Below 13 m. there is almost entirely solid ice with an occasional thin layer of bubbly ice with a density of 0.6.
Two cavities surprised the driller, both had dense ice roofs and floors; the floor of the lower one sloped and at least was large enough to prevent 2 cu. m. of dry snow, tipped down the hole, from forming a heap on the floor beneath the roof hole. The upper cavity was at a depth corresponding to 25–30 years of current deposition. The cavities were probably the upper parts of old bridged crevasses, for crevasses with unbroken sagging bridges were common 1 km. away.
The greater accumulation at A2 would be sufficient to form a much greater thickness of 0.5 density firn there than was found at A1.
The interpretation of the pit data in the firn zone, as regards the time when the various layers were formed, is not simple, because:
the melting season is brief and intermittent, and the snow that falls during this period is comparable in quantity to the amount that melts;
the melt of the current season forms ice layers within the previous year’s firn, which is well below the melting point at the time, and therefore the lower limit of the previous year’s firn cannot be defined;
it was not possible to recognize any of the earlier accumulation years;
not the slightest trace of dirt was found in any firn-zone pit or in the deeper boring;
the present melt season left behind a different record of deposition to the previous year (either the melting was less, the snowfall greater or, rather unlikely, a significant amount of melting occurred after evacuation).
Moreover, it is difficult to define the end of the budget year, especially in the firn zone, because of the snowfall during the intermittent melting period. Arbitrarily the end of the ablation season (hence the budget year) is defined as the date of the greatest elevation of the firn line, which coincides just below this level with the last date the superimposed ice is exposed, and above the firn line with the lowest recorded level on a snow stake. This definition is fairly satisfactory in this area, because the ice cap does not rise far above the firn line, but it may be quite unsuitable in other regions.
The top of the previous year’s firn could be recognized, as already mentioned, as a strongly-bonded zone with a density of 0.45–0.5 gm./cm.3, and it consisted of irregular crystals  mm. diameter, mostly in clusters. Its upper surface was quite abrupt and only in some areas had a thin ice crust. Its depth varied irregularly with altitude over the upper parts of the ice cap, as did the quantity of snow accumulated above. A rough idea of the variation can be obtained from the old firn depths given in Fig. 5c. Camp A2 was the snowiest place found, while Camp A1 and Stake 8 in the low col north-west of A2 were much less snowy. These variations in settled snow are mainly due, judging from experiences in May and June at Camp Al, to the varying effects of snow drift in the different situations. Snow that fell one day would blow away two days later, and all the decreases in surface level recorded at A1, other than during melting periods, were caused by wind erosion. The quantity of settled snow is not therefore a direct measure of the precipitation.
Above the old firn was a layer of autumn snow which was recognized all over the ice cap and at least as far down as A3 in the lowest pit (26 June, see Fig. 6) dug in the ablation zone before melting had extended to the ice. The autumn snow contained a number of icy crusts and bands; it consisted of loose, weakly-bonded clusters of irregular prisms, some columns and in places depth hoar cups, with a crystal size of  mm. and the density was around 0.3. In the ablation area of Highway Glacier it was rather coarser, more strongly bonded and the density was around 0.37.
All over the top of the ice cap, but curiously not at A2, the autumn snow was terminated uppermost by a “diagonal band” (see Fig. 8), easily recognized. It was a perfectly regular layer of single freezing rain crystals, 2–3 cm. long, with all their axes parallel and inclined upwards into the direction of the wind—at the time north-east. The formation of a similar band at the surface was witnessed at A1 on 26–27 July. These crystals too pointed north-east, but they melted away by 29 July and left future observers without a clue. Our “diagonal band,” however, persisted through the melting zone. No deeper diagonal band could be found in the upper three metres.
The more recent snow of winter and early spring was much finer, 0.3–1 mm. size, and consisted of broken prisms and columns, ranging in density from about 0.25 to 0.35 gm./cm.3. It was quite wealdy bonded and contained a few thin crusts.
The uppermost snow was often wind slab with a ripple structure and with gaps below.
The current snowfall, when it came without much wind, usually consisted of fairly feathery dendrites, hexagonal plates and a few capped columns. On one occasion there was a fall of the lightest spatial dendrites, like miniature dandelion seeds. No crystals were large, usually 1–3 mm. The blizzard snow seemed to consist chiefly of broken dendrites.
Although considerable quantities of rime and some hoar frost formed at night on all objects above the surface, the amount that formed on the snow surface at Camp A1 was quite small; often it was eroded subsequently by the wind. Typically a sparse layer 2–3 mm. thick would form on the snow surface, when as much as 4 and 10 cm. would form on an upstanding bamboo at heights of 2 and 100 cm. respectively above the surface.
(d) The progress of snow melting
In the ablation zone of Highway Glacier the snow surface started melting fairly suddenly and with great intensity, soon after the snow on the valley cliffs had sent down melt streams to inundate many of the smaller edge crevasses. Melting of the glacier snow continued every day and was checked only for a few hours on each of the frequent clear nights. For example, on the stretch between A3 and Stake 7 the glacier snow started melting rapidly on 23 June, yet in the late evening of the 25 June the hard icy surface crust made a ski descent involuntarily rapid.
From 26 June to 26 July the progress of ablation at A3 is shown in the pit diagrams in Fig. 6. By 27 June the melt water had descended to the glacier ice surface and the formation of superimposed ice commenced. In a similar way the melt water, in its descent, formed ice layers on top of the limited impermeable areas of existing buried ice crusts. Where the melt water found its way through passages in the crusts, ice glands were formed vertically beneath by lateral heat loss. In 10 days the snow had become very wet, the rounded crystals were 2–4 mm. diameter and a density of about 0.45 was reached. Thereafter the crystal size and the density changed very little and the melt water flowed steadily downhill over the superimposed ice surface every day. At this density skiing proved to be not too bad—surprisingly good considering the wetness of the snow.
The large encircled figures to the left side of each pit in Fig. 6 are the water equivalents in centimetres of all the snow, ice and water above them. The increase from 35 to 37 cm. between 26 June and 2 July is probably accounted for by more melt water having flowed into the area of the latter pit than out of it.
At A2 the melting was intermittent, and since it was not a permanent camp the process could not be followed closely. The melting probably started on 25 June and by 3 July the melt water had sunk about 35 cm. from the surface to form three fairly persistent ice layers (see Fig. 7). On the clear night of 12 July, when the two authors coming independently from camps in opposite directions met there, the surface was covered with 3 cm. of new velvet snow. The surface temperature was —10° C. and the whole profile was well frozen. On 19 July and 4 August the melting zone extended nearly to the surface of the previous year’s firn, but there was a deep frozen crust at the surface on 4 August, as at A1. The water equivalents are ringed at several corresponding levels in each pit at A2 in Fig. 7. Between 3 July and 4 August there is an increase in the water equivalent at the two lower levels of 12 and 14 cm. respectively. The difference in these two values is within the possible variations from one pit site to another and errors inherent in density measurements. There does not appear to be such a large increase in the water equivalents at the upper two levels —only about 6 cm. This is probably because current melted precipitation had passed through the upper snow and ice layers and formed ice at a lower level.
At Camp A1, on the top of a dome, the periods of melting at the snow surface are shown in Fig. 8. There were two short periods on 25 and 27 June, then came three main periods 13/15 July, 19/20 July and 23/26 July, and subsequently a number of short midday periods. The short melts in June had little effect and in Pits 4 and 5 the whole profile was frozen. In Pit 6, excavated during the first main melting period, pockets of water fed from the surface melting zone were found in the midst of snow as cold as —3° C. In Pit 7, excavated 2 days later, new snow overlaid a refrozen zone and beneath was a melting zone above a new ice layer. From there to the top of the diagonal band the snow was irregularly damp and the temperature conditions were quite complex. A few knobs of ice were found for the first time on top of the diagonal band in this pit.
Pit 8 was dug after the second main melting period, when more fresh snow had settled. There was a thin melting layer beneath a thick icy crust and a persistent ice layer above the diagonal band. A few knobs of ice were found on top of the diagonal band and some as far down as the surface of the old bonded firn, where the temperatures were irregular and below freezing.
In Pits 9 and 10, excavated during and after the third main melting period, the whole profile was melting well down into the old firn. In the absence of consistent old ice layers in the old firn to act as a guide it was not possible to decide whether ice layers or glands represented new formations or some existing from the previous melt season. Some melting must have occurred, but the amount averaged over a large area is probably small.
In Pits 11 and 12 a thick icy zone existed at the surface and had been frozen every night and on many days. In Pit 11 the depth of the melting zone was much less than in Pit 12, but this difference is more likely to represent the type of variation to be expected between one pit site and another than a time change of conditions. The existence of some small vertical boreholes near Pit 12, which were refilled in May, might also account for the greater depth of melting in Pit 12.
Generally it was not easy to decide on the limits of the melting zone, particularly at the lower surface. The irregular nature of that surface, owing to the local descent of water through ice layers, presented one difficulty, but also it appeared from measurements in the pits that the finer snow could be damp and sticky and yet at a temperature of —0.1 to —0.2° C. Thermometer errors were suspected but could not be found. Then a direct comparison was made simultaneously in two identical containers under identical conditions in the melting atmosphere of a tent. One container held fine, slightly damp snow and the other coarse wet snow. It was noted repeatedly with the same thermometer that the temperature of the fine snow was about —0.1° C., while the coarse snow was at 0° C. Whether this depression is due to the higher water suction in the finer snow, or to salt concentrations, or to a combination of both effects, is not known, but it would be interesting to know of other field experiences of this depression.
Two slim birch dowels were pushed down about 150 m. apart at Camp A1 onto the surface of the old firn on 18 June. The level of the snow surface was read relative to the tops of the dowels simultaneously with the surface Ievels relative to bamboo stakes nearby, and sunk below the greatest depth of melting. After 29 July the bamboo stakes indicated a fall in surface level as plotted in Fig. 8, but except during the melt on 5 August the snow surface did not sink relative to the two dowels. It may be concluded from these observations that melt water is descending within the old firn and causing compaction.
At the times of the various pits at Camp A1, the cumulative water equivalents in centimetres of new settled snow, rainfall, total snow and ice to the top of the diagonal band and to the top of the old firn are given in Table I below. The amounts of new settled snow were estimated from the stake measurements and from density plus depth measurements in the uppermost layers in the pits. The amounts of snow that blew away have been omitted and the amounts that drifted into the area have been included. The rainfall was measured in the usual gauge. The columns (a+b+c) and (a+b+d) are the initial Pit 1 accumulations added to the new settled snow and rain down to the levels of the diagonal band and of the old firn top respectively. A comparison of the last two columns in Table I shows discrepancies of up to 2 or 3 cm., but smaller errors can scarcely be expected. There is a suggestion that melt water had descended into the old firn in Pit 12.
Water Equivalents Of Accumulation At Camp A1
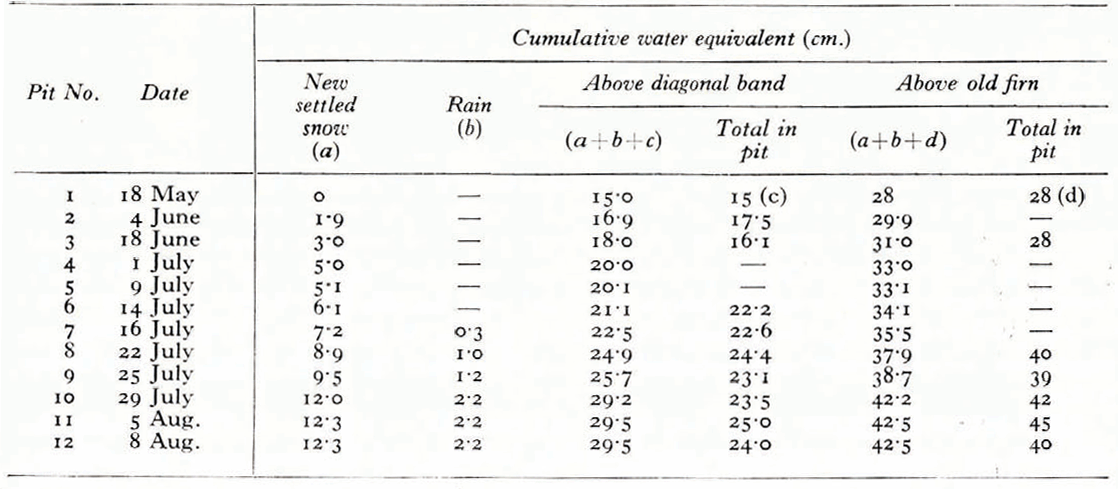
The columns in Table I relating to the snow above the diagonal band show that melt water had passed below the band from the date of Pit 8 onwards—a fact already noted in the pits. The total amount passing through the band, which proved quite porous yet did not disappear, was about 5 cm. of water, or about one-third of the total settled snow and rain (14.5 cm.) during our stay. The total annual accumulation was about 4.3 cm. of water.
(e) The amount of melting and total ablation
The amount of melting at any stage of the process cannot be estimated precisely unless the total amount of free water in the profile is known before and after each melt. There is as yet no simple field method of measuring the amount of free water in a snow profile. The total ablation in the ablation zone is simply measured because all the water runs away over an impervious ice surface. In the firn zone even the total amount of melting can only be estimated roughly, for surface sinking may be due not only to surface melting, but also indirectly to the descending melt water causing compaction of the particles of snow.
At Camp A1 there was, by measurement, no settlement of the diagonal band up to 26 July; what happened subsequently is not known because the band was too weak to support a marker. The general levels of the band in Fig. 8 show no extensive sinking. The top of the old firn did not sink until after 29 July, as already mentioned. In the upper layers the amount of sinking which is not a direct index of melting is not known and cannot be distinguished.
The three main melt periods at Camp A1 (see Fig. 8) were preceded by a new deposit of snow, which started to melt at a density around 0.2 and finished melting at a density over 0.4. The surface sinking was greater than the thickness of new snow, hence an estimate based on the new snow density times the sinking is probably an underestimate of the amount melted. For an upper limit the melting could involve the total thickness of new snow and some of the denser snow beneath. In the intermittent melting period at the end of the season nearly all the sinking originates below the top of the old firn; a melting estimate based on the density of the old firn would be an upper limit. Working in this way, between limits, it is estimated that the total melt during occupation of A1 lies between 10 and 15 cm. of water. These values do not seem unreasonable, since it has been shown that about 5 cm. of water passed through the diagonal band. The evaporation in the firn zone is very small.
The data at the other sites, 7, A2, 8 and 9, in the firn zone are not sufficient to allow more than a very rough estimate of the amount of melting.
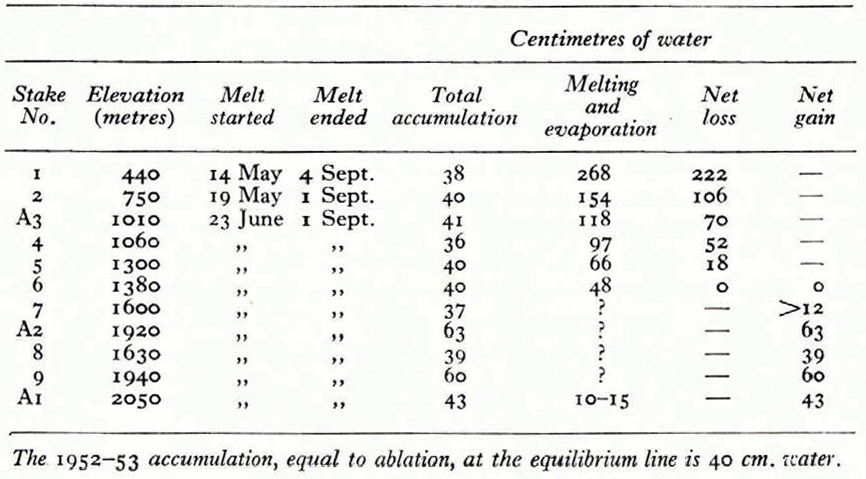
In Table II the total accumulation, melting, net loss or gain of water (cm.) are summarized at the various altitudes. The errors should be within ± 3 cm. in the worst cases. The dates when melting started at Stakes 1 and 2 are possibly too early, and the dates when melting finally finished are approximate everywhere. The melting towards the end of the period is quite small anyhow.
(f) The firn line
A number of pits were dug towards the end of the melting season between Stakes 6 and 7 where the firn line lies, and it was found at about 1550 m. on this glacier. At this time a considerable quantity of water flows down the glacier through the firn and issues out over the bare superimposed ice below. Hence the amount of melt water that is retained by the old firn is not known, and at Stake 7 it is only possible to quote a lower limit for the net gain (see Table II). The equilibrium line, where there is neither a gain nor a loss of water and where the superimposed ice of the summer (and autumn) just disappears, is close to Stake 6 at about 1380 m. In this case the area where there is a net gain of superimposed ice is small because the surface slope is steep in that region.
Annual Accumulation, Melting, Net loss Or Gain At Various Elevations
In the course of a journey west-south-west from Camp A1 on 28 July the firn line region was crossed on the very gentle slope of a broad ice lobe. After leaving the snow, an unavoidable area of water about 10 cm. deep and overlying superimposed ice was traversed for about 4 km. The water was filling up very narrow crevasses at regular intervals of about 30 m. At this time the firn line had retreated to about 1520 m.
On 10 August, during the evacuation journey north-west from Camp A1 into the head of Coronation Glacier, the firn line slush was crossed at about 1560 m.
Acknowledgements
The authors wish to acknowledge the valuable assistance of B. Bonnlander, S. Orvig and H. Röthlisberger in maintaining observations. One of us (W. H. W.) wishes to acknowledge the help from the Royal Society for a Government Grant-in-Aid and from the Department of Scientific and Industrial Research for providing facilities for carrying out the study.



