


Obesity represents one of the most important metabolic diseases worldwide. In recent decades, the prevalence of overweight and obesity has doubled, globally, while it has been estimated that by the year 2030, the number of obese people will reach 1·21 billion(Reference Antelo, Magdalena and Reboredo1). In addition, in Iran, almost 21·7 % of adults are affected by obesity(Reference Rahmani, Sayehmiri and Asadollahi2). BMI is one of the most common and simple methods used in many epidemiological studies, which has been proposed as a tool for screening and early clinical evaluation of obesity(Reference Cornier, Despres and Davis3). However, BMI has some limitations since it is an indicator of total body fat and does not provide information about localised abdominal fat that is associated with metabolic disease. Some studies showed that the pattern of fat distribution in the body plays a key role in identifying chronic disease(Reference Esmaillzadeh, Mirmiran and Azizi4) and people with fat accumulation in the abdomen are at a higher risk of diabetes, hypertension and CVD(Reference Azizi, Esmaillzadeh and Mirmiran5). In this regard, other anthropometric indicators such as waist circumference (WC) and waist-to-hip ratio (WHR) are superior to BMI for revealing obesity and overweight. WC and WHR are mostly used to express how fat is distributed in the body, and WHR is widely applied to distinguish between the central and peripheral distribution of adipose tissue(Reference Lee, Huxley and Wildman6,Reference Taylor, Brooking and Williams7) .
Socio-demographic determinants of obesity have been of great research interest recently. It is demonstrated that certain health behaviours including smoking and physical activity are associated with obesity(Reference Gruber and Frakes8,Reference Fogelholm and Kukkonen-Harjula9) , and it has been reported differences in obesity prevalence across various sex, age and socio-economic groups(Reference Paeratakul, Lovejoy and Ryan10). Socio-economic status is usually measured by education, occupation, employment, income and wealth. Overall, higher welfare level and higher and higher socio-economic status were observed to be associated with a lower BMI, WC and WHR(Reference McCormack, Friedenreich and McLaren11). This may be due to a healthier diet in subjects with a higher level of education, income and socio-economic status(Reference Ruf, Nagel and Altenburg12), as well as a higher degree of physical activity(Reference McCormack, Friedenreich and McLaren11).
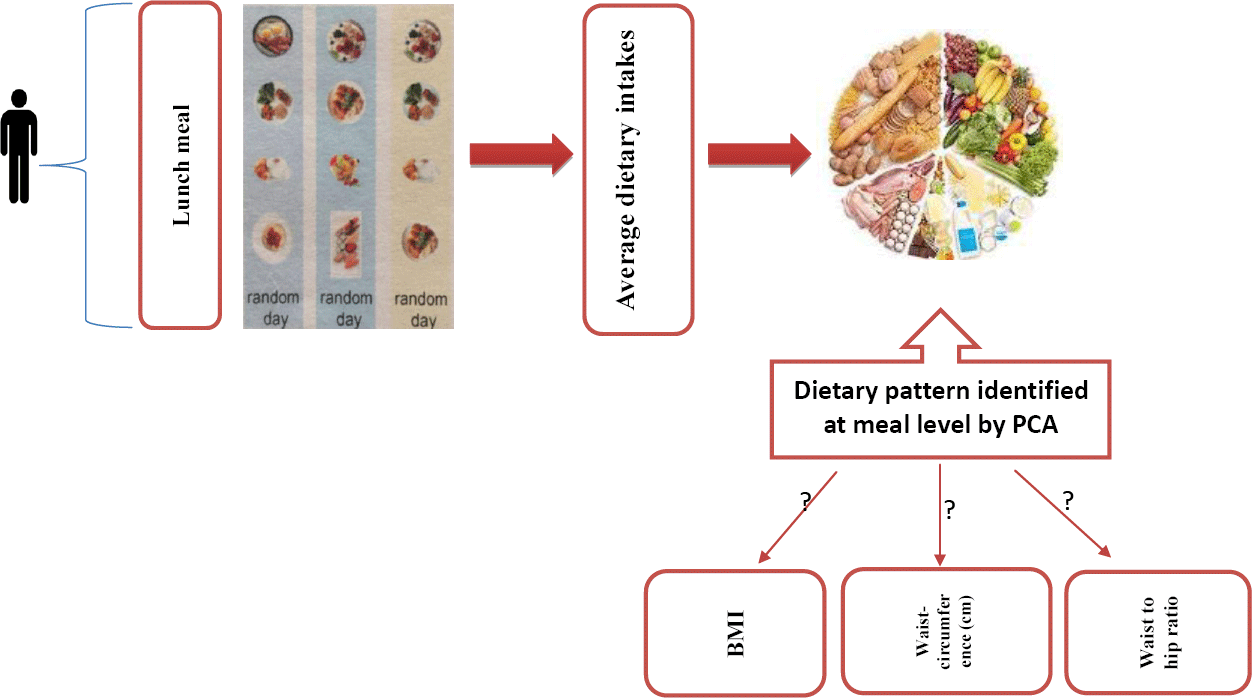
Diet is the fundamental component of a healthy lifestyle which can play a significant role in the prevention of non-communicable diseases(13). Previous studies have tended to focus on individual foods or nutrients; however, given the complexity of human diets, several authors have proposed the analysis of overall dietary patterns(Reference Hu, Rimm and Smith-Warner14,Reference Hu, Rimm and Stampfer15) . Moreover, the relationship between dietary patterns, considering the complexity of diets and the potential interaction between food components, and obesity has been well documented in the literature(Reference Cunha, de Almeida and Sichieri16–Reference Shu, Zheng and Zhang18). Findings, such as the association between the Mediterranean diet and low rates of chronic diseases, or the successful treatment of hypertension through changes in dietary patterns, have suggested the investigation of dietary intake patterns(Reference Helsing19,Reference Sacks, Svetkey and Vollmer20) . Apart from well-founded evidence regarding the benefits of vegetables, fruits, fibre, nuts and fish, and the value of reducing or eliminating snacks, people regularly consume combinations of foods in three or more meals per day(13,Reference Hu21) . The main meals are described as foods that are typically consumed in the largest volume(Reference Leech, Worsley and Timperio22,Reference Bellisle, Dalix and Mennen23) . It is important to acknowledge that different nutritional compositions in main meals may have an impact on diet quality and influence diet–disease relationships. There is an association between meal patterns and energy balance and weight status(Reference Mesas, Muñoz-Pareja and López-García24,Reference Szajewska and Ruszczyński25) . Results of a study in Brazilian population showed that the traditional Brazilian lunch pattern is inversely associated with obesity in insufficiently active individuals(Reference de Oliveira Santos, dos Santos Vieira and Miranda26). In another study, breakfasts containing > 25 % of total energy intake and lunches containing > 35 % of total energy intake were associated with an increased likelihood of central obesity(Reference Aparicio, Rodríguez-Rodríguez and Aranceta-Bartrina27). Indeed, previous studies have shown that the lunchtime meal represents the highest proportion of protein, fat and carbohydrate intake(Reference Almoosawi, Winter and Prynne28) and supplies about 30% of the daily energy intake(Reference Benelam and Stanner29). Therefore, this study aimed to, first, identify major dietary patterns at lunch, and, second, to determine their association with obesity among adults living in Tehran.
Subjects and methods
Participants
This cross-sectional study was conducted using a sample of 850 men and women, aged 20–59 years, who have visited the health centre and were been selected from the five regions of Tehran from 2018 to 2019. The following formula was used for sample size calculation: n (pqz2)/E2. Considering the total prevalence of 65 % for overweight and obesity(Reference Ahmad Kiadaliri, Jafari and Vaez Mahdavi30), an error coefficient of d = 0·04 and at a level of 0·05, the sample size of 546 people was obtained. With a design effect of 1·5 and to compensate for the potential exclusion of participants due to under- and over-reporting of total energy intake, or attrition due to other reasons, the final sample size of 850 participants was selected for inclusion. A two-stage cluster sampling was used to recruit participants from health care centres. First, we classified health centres into five districts of the city including North, South, East, West and centre. Next, a list of all health centres that existed in each district was provided. Then, twenty-five health centres (due to budget and time limits) were divided according to the number of health centres in each area. After a randomised selection of health care centres from enlisted health centres in each region, the number of eligible health centres was randomly selected. Subsequently, the total sample (850) was divided by the number of health centres (25), yielding the required number of samples in each health centre. Following this, we entered each of the health centres, and those who willing to participate in our study and those who were members of the health centre and living in Tehran were included and conducted random sampling to ascertain the required number of samples needed and on the other hand, at the end of the interview with the individuals, nutritional information appropriate to each person’s conditions was provided to them. Subjects were considered eligible for inclusion if the following criteria were met: (a) participants within the age range of 20–59 years; (b) apparently healthy individuals who did not report any previous diagnosis of chronic diseases such as diabetes, CVD and chronic kidney, lung and liver diseases by a physician; (c) be willing to take part in the study; (d) being a resident of Tehran and (e) being a member of the health centre. Participants were excluded from the analysis if (a) their daily energy intake was implausibly low or high (<3347·2 kJ/d or >17572·8 kJ/d); and (b) those who did not report any adherence to certain dietary patterns, any special diet or diet therapy such as vegetarian diet. The sample collection was facilitated by the coordination of the Health Bureau of the Municipality of Tehran and the co-operation of the health centres of Tehran.
Outcome measures
Weight and height were measured according to the standard methods(Reference Lohman, Roche and Martorell31). Weight was recorded to the nearest 100 g while minimally clothed and unshod using digital scales. Height was measured in a standing position, unshod, using a tape stadiometer to the nearest 1 mm, while the shoulders were maintained in a normal position. BMI was calculated using the following formula: weight in kg, divided by height in meters squared, expressed as kg/m2. General obesity was defined as BMI ≥ 30 kg/m2(32). WC was recorded to the nearest 0·1 cm at the umbilical level and hip circumference at the maximal point over light clothing, using a non-stretch tape meter, without putting pressure on the body surface. Central obesity was defined as WC ≥ 102 in men and WC ≥ 88 in women, respectively, and a WHR above 0·90 for males and above 0·85 for females, respectively(33). Participants rested for 15 min before blood pressure was measured. Then, a trained assessor measured blood pressure twice, with the participant in a seated position, with a standard mercury sphygmomanometer and the mean of two measurements was calculated.
Dietary assessment
Dietary intake was assessed using three 24-h dietary recalls. The first recall took place during the participants’ first visit to the health centre. The other two 24-h dietary recalls were obtained at random days, including weekends over the phone. All 24-h dietary recalls were performed by trained interviewers. Any food or beverage that the participants consumed during the denominated meal time was considered. Finally, the standard unit size and items reported based on home weighing scales were converted into g using the home scale guideline(Reference Ghaffarpour, Houshiar-Rad and Kianfar34). The data from these questionnaires were entered into a purpose-built excel spreadsheet, where the gram equivalent was obtained for each item and each individual. In addition, we used Nutritionist IV software (First Databank), modified for Iranian foods, to analyse the energy and nutrients of food items. Lunch was predefined as a large meal eaten between 12.00 and 16.00 hours(Reference Kahleova, Lloren and Mashchak35). Foods were grouped according to similar nutritional values, Iranian consumption habits, literary data and experience of the research team in previous studies(Reference Karamati, Jessri and Shariati-Bafghi36–Reference Lockheart, Steffen and Rebnord38). Some individual food items that consisted of separate items (e.g. eggs) or that represented special dietary habits (such as potatoes) were retained as a single food. Moreover, it should be noted that some single FFQ items (salt and potatoes) considered as a single group because in the FFQ there were no other food items to be appropriate for combination with these foods into multiple-item food groups. Finally, we created twelve pre-determined dietary groups (bread and grains(Reference Serra-Majem and Bautista-Castaño39,Reference Liu, Willett and Manson40) , dairy products(Reference Wang, Wu and Zhang41,Reference Barba and Russo42) , poultry(Reference Donma and Donma43,Reference Petermann-Rocha, Parra-Soto and Gray44) , eggs(Reference Liu, Zhao and Li45,Reference Saande, Bries and Pritchard46) , fat(Reference Lissner and Heitmann47,Reference Gillis, Kennedy and Gillis48) , potatoes(Reference Borch, Juul-Hindsgaul and Veller49,Reference Schwingshackl, Schwedhelm and Hoffmann50) , processed meat and red meat(Reference Rouhani, Salehi-Abargouei and Surkan51,Reference Dabbagh-Moghadam, Mozaffari-Khosravi and Nasiri52) , soft drinks(Reference Gibson53,Reference James and Kerr54) , vegetables(Reference He, Hu and Colditz55), legumes and nuts(Reference Martínez-González and Bes-Rastrollo56), salt(Reference Ma, He and MacGregor57) and sauces(Reference Appleton58)) which also had an association with obesity. Also, for some foods like potato, eating habits of our population has been considered. As white potato is a good source of carbohydrate, dietary fibre and resistant starch, it is a favourite staple food in several cultures as well as a good source of vitamin C and K, especially in Iran. Moreover, due to the high content of carbohydrate, it is suspected to have a link to obesity, and most common foods with potato in Iran contain more fat energy content than carbohydrate energy content. Then, we decided to consider potato as a separate food group in our study.
Assessment of other variables
Physical activity information was obtained using participants’ oral responses to the international physical activity questionnaire and expressed as the metabolic equivalent h/week (MET-h/week)(Reference Ainsworth, Haskell and Whitt59). We asked the participants to think about all the intense and moderate activities that they engaged in during the past 7 d, considering the time spent on these activities, before completing the questionnaire. Additional covariates, including age (year), BMI (kg/m2), an education level (illiterate, under diploma (Primary School, Secondary School, High School), diploma, University degree), marital status (married or other), occupation (employee or unemployed), medical condition (healthy or underlying disease), smoking status (not smoking, quit smoking, smoker) and lifestyle (living alone, with someone), were obtained using questionnaires. Furthermore, we defined underlying diseases in this study as diabetes, hypertension, dyslipidaemia, CVD, cancer and respiratory disease. According to the self-reporting of participants in the study, if a person had one of the diseases considered in this research, he/she would receive code 1 and otherwise code 0. Finally, if the individual did not have any of the respective diseases, he/she was classified in the healthy group, and those who even had one of the diseases were assigned to the group with underlying disease.
Statistical analyses
Factor analysis (principal component analysis) was used to identify major lunch consumption patterns based on twelve pre-determined dietary groups, and two interpretable factors were retained based on the scree test(Reference Rezazadeh, Rashidkhani and Omidvar60). Then an orthogonal rotation method (varimax rotation) was applied to simplify the factor structure and present it in an interpretable manner. The number of factors retained from each dietary pattern classification method was determined by eigenvalues (>1·10), scree plots and factor interpretability. Higher loadings (≥0·2) show that the food shares more variance with that factor. The derived factors (lunch patterns) were labelled based on our interpretation of the data, as well as on prior literature. The factor score for each pattern was calculated by collecting consumed food groups, weighted by factor loadings, and each participant determined the score for each identified pattern. Pearson correlation coefficients were also computed to identify the association between food groups. We used one-way ANOVA, with Tukey post hoc comparisons where appropriate, for quantitative variables, and χ 2 tests for qualitative variables, to determine significant differences across tertiles of lunch pattern scores. The association between major dietary patterns and general and central obesity was assessed by logistic regression analysis. ANCOVA was used to adjust for covariates as follows: in the first model for age, sex, education, marriage, lifestyle and smoking, while the second model was adjusted for model 1 plus physical activity and total energy intake. Logistic regression analysis for general and central obesity, according to lunch patterns, was used to obtain the OR and 95 % CI, which were adjusted for potential confounders, including age, sex, education, marriage, lifestyle, smoking, physical activity and total energy intake. Confounders were selected based on literature review including age (years), sex (male or female), physical activity level, smoking status (never smoke or former/current smoker) and total energy intake.
All data were analysed using the statistical software package SPSS version 22, and statistical significance was accepted at P < 0·05.
Results
Of the 850 participants who enrolled in the study, sixty were excluded due to a lack of adequate information and lack of co-operation in their recall report; thus, 790 remained in the study for final analysis. In general, the average energetic intake at lunchtime was higher than other meals (Fig. 1).
The distribution of energy content was consumed across the time of day. ![]() , mean energy.
, mean energy.

Using the factor analysis method, three major dietary patterns were identified and presented in Table 1. Factor 1, named the ‘Bread, grains and fat’ dietary pattern, had high and positive factor loadings for fats, bread and grains, salt, vegetables, poultry and fish and high negative factor loadings for legumes and nuts and sauces; factor 2, named the ‘Potato and eggs’ dietary pattern, had positive factor loadings for potato and eggs, and high negative factor loadings for intake of bread and grains, nuts and legumes; and finally factor 3, named the ‘Western’ dietary pattern, showed positive factor loadings for red or processed meat, sauces, soft drinks, nuts and legumes and negative factor loadings for poultry and fish and dairy products.
Food groups used in the factor analysis and factor loadings for each of the identified lunch patterns*

* Factor loadings of < 0·2 have been removed to simplify the table.
Table 2 provides an overview of the distribution of qualitative and quantitative variables across tertiles of major dietary patterns. No significant difference was found in the distribution of qualitative variables across the tertiles of three major dietary patterns. Adherence to the ‘Potato and eggs’ pattern was associated with an increase in age (P = 0·04) and blood pressure (P = 0·03). Mean intake of vegetables (P < 0·001), dairy products (P = 0·01), grains (P < 0·001) and meat (P = 0·006) was higher at the third tertiles of the ‘Bread, grains and fat’ dietary pattern in comparison with the first tertile. Moreover, adherence to the ‘Eggs and potato’ dietary pattern was associated with the higher intake of vegetable (P < 0·001) and grain (P < 0·001). In addition, the mean intake of dairy products, grains and meat was significantly different across the tertiles of ‘Western’ dietary pattern.
Characteristics of the study participants by tertiles (T) of lunch pattern scores
(Numbers and percentages; mean values and standard deviations)

P-values obtained using χ 2 test.
* Diabetes, hypertension, dyslipidaemia, CVD, cancer and respiratory disease.
Heat map shows the Pearson correlation matrix of food groups at lunchtime. Correlation analysis showed that there were strong positive correlations between potato and eggs (P < 0·001), while strong negative correlations were found between nuts and legumes and fish and poultry (P < 0·001), and between meat and processed meat and fish and poultry (P < 0·001) (Fig. 2).
Heat map showing the Pearson correlation matrix for lunch food intake in g (n 790) by food groups. The colour corresponds to the strength of correlations (red: positive correlation; white: no correlation; blue: negative correlation).

Multivariable-adjusted means for anthropometric measures and indexes across tertiles of dietary patterns are depicted in Table 3. The results showed that higher adherence to the ‘Bread, grains and fat’ dietary pattern was associated with a higher WHR (P = 0·04). In addition, the mean weight significantly increased across the ‘Egg and potato’ dietary pattern (P = 0·02). However, there was no significant relationship after controlling for confounding factors. Also, there was no significant difference in means and standard deviations of other anthropometric measures across major dietary patterns at lunchtime.
Multivariable-adjusted means for anthropometric measures and indexes across tertiles (T) of lunch pattern scores
(Means and standard deviations)

aModel 1: adjusted for age (continuous), bmodel 2: additionally adjusted for marital status, education, physical activity, smoking and cmodel 3: further adjustment for dietary intake of fruits, vegetables, dairy, grains, energy intake.
P-values obtained using ANCOVA test.
Unadjusted and adjusted OR for the participants’ general obesity in the tertiles of lunch patterns are presented in Table 4. According to our findings, after control for confounders, there were no significant associations between ‘Bread, grains and fat’ pattern (OR: 0·89, 95 % CI 0·60, 1·33, P-value = 0·59), ‘Eggs and potato’ pattern (OR: 1·07, 95 % CI 0·71, 1·60, P-value = 0·36) and the Western dietary pattern (OR: 1·32, 95 % CI 0·88, 1·99, P-value = 0·17) with general obesity.
General obesity (BMI ≥ 30) across tertiles (T) of dietary patterns score
(Odds ratios and 95 % confidence intervals)

aModel 1: unadjusted, bmodel 2: age, sex, education (categorical), marriage, lifestyle, smoking and cmodel 3: model 2 + physical activity, total energy intake.
Table 5 shows the unadjusted and adjusted OR for central obesity across the tertiles of major dietary patterns at lunchtime. In the unadjusted model, no significant association was found between central obesity, based on WC definition, and dietary patterns which remained unchanged even after adjustment for confounders. No significant difference was also observed in the odds of central obesity, when defined based on a WHR, across the tertiles of the ‘Bread, grains and fat’ dietary pattern (OR: 1·38, 95 % CI 0·98, 1·95). However, after adjustment for confounders, the participants in the top tertile of the ‘Bread, grains and fat’ pattern had a 1·44 times higher chance of central obesity (OR: 1·44, 95 % CI 1·01, 2·07) relative to individuals in the first tertile. No significant associations were observed between adherence to the ‘Western’ pattern and ‘Eggs and potato’ patterns with OR of central obesity in our population.
Central obesity across tertiles (T) of dietary patterns score
(Odds ratios and 95 % confidence intervals)

Model 1: unadjusted, model 2: age, sex, education (categorical), marriage, lifestyle, smoking and model 3: model 2 + physical activity and total energy intake.
Discussion
The present study, which was conducted on 850 adults in Tehran, showed that 25·4 % of subjects had general obesity. In addition, 46·6 and 54·8 % of subjects had central obesity based on WC and WHR, respectively. The results of this study showed that participants in the top tertile of the ‘Bread, grains and fat’ pattern had a 44 % higher risk of increased WHR compared with the participants in the lowest tertile. There were no significant associations between the ‘Western’ and ‘Eggs and potato’ patterns at lunchtime and central obesity. Moreover, our findings showed that there was no relationship between major dietary patterns at lunchtime and general obesity.
Socio-demographic determinants of obesity have been of great research interest recently. It is demonstrated that certain health behaviours including smoking and physical activity are associated with obesity(Reference Gruber and Frakes8,Reference Fogelholm and Kukkonen-Harjula9) . Diet, total energy intake, physical activity, sedentary lifestyles and other health-risk behaviours are known to act as proximate, intervening variables in the relationship between socio-economic status and obesity(Reference Singh, Siahpush and Hiatt61) In addition, it was found that obesity prevalence varies across various sex, age and socio-economic groups(Reference Paeratakul, Lovejoy and Ryan10). Socio-economic status is usually measured by education, occupation, employment, income and wealth. For example, lower education, lower occupational status and lower incomes have been associated with a higher prevalence of obesity(Reference McLaren62). It has been found that smokers are likely to be obese(Reference Berlin63). It has been shown that smoking increases levels of cortisol and testosterone, whereas the levels of estradiol and progesterone are decreased(Reference Dušková, Hruškovičová and Šimůnková64). Furthermore, it has been reported that smoking changes dietary habits, leading to a lower intake of fibres, fruits and vegetables(Reference Dušková, Hruškovičová and Šimůnková64). Physical activity has also been established as one of the important predictors of weight gain. In that, those who have enough physical activity, especially during leisure time, are less likely to be obese(Reference Fogelholm and Kukkonen-Harjula9).
Given the complex combinations of nutrients involved in the human diet, identifying dietary patterns may represent the best way to highlight the effects of nutrients and specific foods on health(Reference Ocké65,Reference Hu66) , permitting insight into the synergistic outcomes of nutrients and foods. However, most previous studies have investigated diet in general, regardless of the timing of food intake, and consequently, they were unable to identify specific meal characteristics and compositions(Reference Andersson, Nydahl and Gustafsson67). Bellisle et al., reported that the greatest nutrient consumption over an average day occurs around midday, corresponding to lunch(Reference Bellisle, Dalix and Mennen23). Therefore, due to the large proportion of the daily energy intake attributed to lunch, such meals should, ideally, provide sufficient amounts of macro and micronutrients to help achieve and adhere to dietary guidelines.
Dietary patterns were specified based on factor analysis using the principal component analysis method with varimax rotation. The resulting factors were judged based on the eigenvalues (the total squared load factor of food items in terms of their consumption in g per day) of food groups, and any factor with an eigenvalue > 1 was considered as the main dietary pattern. Load factor values ≥0·2 were used to describe the main food groups that make up each food pattern.
One of the possible reasons for the difference between the diet patterns of the present study with other studies is that the analysis of dietary patterns is strongly dependent upon the study population. Therefore, significant differences in dietary patterns of different populations are observed by geographical area, race and culture. In addition, factor analysis is limited by the researcher’s choice of food items’ grouping and the number of factors to be retained, and these decisions can somewhat affect the findings and their interpretation.
In the present study, three dominant lunch consumption patterns were identified among the participants: dietary pattern 1 (‘Bread, grains and fat’) was rich in fats, bread and grains, salt, poultry and fish, dietary pattern 2 (‘Eggs and potatoes’) included a high intake of potato and eggs, and a low intake of bread and grains, nuts and legumes and dietary pattern 3 (‘Western’) included a high intake of red or processed meat, sauces, soft drink, nuts and legumes and a low intake of poultry and fish and dairy products. Santos et al. previously identified five lunch patterns, among which the ‘Western’ dietary pattern (positive factor loadings for soft drinks, alcoholic beverages, sweets, gnocchi/stuffed pasta, sauces/mayonnaise and processed meats) was relatively similar to our ‘Western’ dietary pattern(Reference de Oliveira Santos, dos Santos Vieira and Miranda68). In addition, our ‘Bread, grains and fat’ dietary pattern was similar to Santos’ ‘meat’ dietary pattern (positive factor loadings for eggs, poultry meat and fish/seafood; negative for beef). However, some of the items found in Santos’ ‘meat’ dietary pattern (like eggs) were also found in our other dietary patterns. Similarly, Schwedhelm et al. also identified five lunch meal patterns(Reference Schwedhelm, Iqbal and Knüppel69), among which the ‘Western’ pattern (high intake of potatoes, cabbage, red meat, beer, sauces and condiments and low intake of fresh fruits, milk and dairy products and tea) was comparable to our ‘Western’ dietary pattern, and their ‘traditional’ dietary pattern (high intake of bread, processed meat, butter, sugar, confectionery, cakes and cookies and low intake of water) was similar to our ‘Bread, grains and fat’ dietary pattern. Moreover, Esmaillzadeh et al. (Iran) identified three dietary patterns(Reference Esmaillzadeh and Azadbakht70), among which the ‘Western’ dietary pattern (high in refined grains, red meat, butter, processed meat, high-fat dairy products, sweets and desserts, pizza, potatoes, eggs, hydrogenated fats, and soft drinks and low in other vegetables and low-fat dairy products) was similar to our ‘Western’ dietary pattern, and the ‘Iranian’ foods pattern (high in refined grains, potato, tea, whole grains, hydrogenated fats, legumes, and broth) was similar to our ‘Bread, grains and fat’ dietary pattern.
Contradictory results among studies may be attributed to distinct differences in the culture, tradition and eating habits of the Iranian people compared with other countries. Additionally, differences in dietary patterns may be attributed to the fact that some studies examined habitual dietary patterns, while in our study, these patterns were derived at the meal level. The present study revealed no association between the ‘Western’ pattern, as an unhealthy dietary pattern, and obesity; indeed, some previous studies have reported similar findings and found no significant association between the patterns rich in fat and sugar and overweight and obesity(Reference de Oliveira Santos, dos Santos Vieira and Miranda68,Reference Craig, McNeill and Macdiarmid71,Reference McNaughton, Ball and Mishra72) . However, it has been reported that adherence to a ‘Western’ or unhealthy pattern dietary increases the risk of overweight and obesity(Reference Lera, Olivares and Leyton73,Reference Herber-Gast and Mishra74) . Given that the ‘Western’ dietary pattern is considered as an unhealthy pattern, the lack of a significant association with obesity was somewhat unexpected. However, the inclusion of some food groups, such as legumes and nuts, in this pattern might have hindered the identification of an association. In addition, no association was found between the ‘Egg and potato’ pattern and obesity, which may be considered as a healthy diet, given that it is rich in fibre, vitamins and high-quality protein. Although the healthy dietary patterns found in some previous studies have been inversely associated with obesity and overweight(Reference Newby, Muller and Hallfrisch75), few studies have shown a positive association between healthy dietary patterns and BMI(Reference Nouri, Tarighat-Esfanjani and Ghazizahedi76). However, some studies have also reported no association between healthy eating patterns and weight status(Reference Craig, McNeill and Macdiarmid71,Reference McNaughton, Ball and Mishra72) , which may conceivably be due to measurement error in the variables under investigation.
In the present study, no significant association was also found between the ‘Bread, grains and fat’ lunch pattern and general obesity. However, participants in the highest tertile had greater odds of increased WHR compared with those in the lowest tertile. The complex nature of this dietary pattern makes interpretation difficult. This pattern contains bread and grains, fats and salt; hence, a positive association was expected between this dietary pattern and obesity. However, some healthy food groups, such as poultry and fish included in this dietary pattern, may have interacted with other foods and counteracted the effects on obesity. On the other hand, it can be argued that the positive association between this dietary pattern and increased WHR is justified by the fact that this food pattern is high in fat and carbohydrates. Low-nutrient density foods can lead to central nervous system insulin resistance, which may, in turn, result in leptin resistance and increased pleasurable responses to foods(Reference Isganaitis and Lustig77).
One of the strengths of the present study is the recruitment of a large sample size compared with other studies in Iran. In addition, all districts of Tehran were selected, so that various socio-economic statuses, educational and welfare levels, and other variables affecting the outcome could be included in the study. The present study also had some potential limitations; for instance, no causal inference could be made due to the cross-sectional nature of the study. Another limitation of this study was that the information regarding the economic conditions of the families could not be collected. As a result, the possible relationship between the economic status of a family with dietary patterns could not be assessed. In addition, the data were collected using retrospective questions, which might have yielded information recall bias.
Conclusion
Greater adherence to the ‘Bread, grains and fat’ dietary pattern at lunchtime was associated with greater odds of central obesity when defined based on WHR. However, no significant association was found between identified lunch patterns and obesity defined by WC and BMI.
Acknowledgements
The authors thank all those who participated in this study. We wish to express our sincere thanks to Dr. Khalid Iqbal from Department of Human Nutrition, Institute of Basic Medical Sciences, Khyber Medical University, Peshawar, Pakistan, for his helpful suggestions during the study. The authors also thank Dr. Carolina Schwedhelm, from Department of Epidemiology, German Institute of Human Nutrition Potsdam-Rehbruecke (DIfE), Nuthetal, Germany for her technical support and help in preparing data.
This manuscript has been granted by Tehran University of Medical Sciences (Grant No: 40186).
S. S.-B. contributed to conception/design of the research; Z. A., S. A. M., N. G., F. S., H. J., M. C. contributed to acquisition of data. Z. A. and S. S.-B. participated in analysis and interpretation of the data; Z. A. drafted the manuscript; K. D, S. S.-B. and C. C. T. C. critically revised the manuscript; and S. S.-B. agrees to be fully accountable for ensuring the integrity and accuracy of the work. All authors read and approved the final manuscript.
We wish to confirm that there are no known conflicts of interest associated with this publication and there has been no significant financial support for this work that could have influenced its outcome.


