


1. Introduction
Why are liberal news media in the US political context often perceived as mainstream, while conservative outlets are seen as niche (e.g., Nadler et al., Reference Nadler, Bauer and Konieczna2020; Mangold et al., Reference Mangold, Schoch and Stier2024; Pew Research Center, 2025)? Using a previously untapped Twitter dataset on users’ following networks and their sharing of online media content, we examine how the network structure of online communities contributes to highly asymmetric information ecosystems. Central to this phenomenon is the understanding that Twitter operates as a network in which following ties define each user’s potential exposure to content. By focusing on network exposure—the content posted by accounts a user follows—we capture the information environments users actively curate through their tie-formation decisions. We study the US segment of the platform in the summer of 2022, during the months leading up to Elon Musk’s takeover in October of that year. We find that through their network contacts conservative users—being in the minority—were overexposed to liberal-leaning content, while liberal users—who comprised the majority—were underexposed to conservative content. As a result, liberal-leaning media were shared across party lines, whereas conservative media were largely ignored by liberal users and circulated mainly within a tight core of strongly conservative accounts. This asymmetry in the dissemination of liberal versus conservative media content mirrors recent findings on Facebook (González-Bailón et al., Reference González-Bailón, Lazer, Barberá, Zhang, Allcott and Brown2023), which highlight “a substantial corner of the news ecosystem consumed exclusively by conservatives” (p. 392). The phenomenon is striking because it underscores an apparent paradox: while conservatives primarily engage with their own media, liberal outlets attract broader audiences, including many conservatives.
A natural explanation for the ideological asymmetry in the exposure to online news lies in different networking behaviors of conservatives and liberals. Users curate their information flow (and signal their identity) by following other accounts (Green et al., Reference Green, McCabe, Shugars, Chwe, Horgan, Cao and Lazer2025), so that news stories reach them through network diffusion rather than having to search for headlines and articles. Differences in homophily preferences when forming online ties offer a behavioral explanation for differential exposure to aligning and cross-cutting content. A body of literature portrays liberals as more tolerant to misaligned news content (Barberá et al., Reference Barberá, Jost, Nagler, Tucker and Bonneau2015; Bail et al., Reference Bail, Argyle, Brown, Bumpus, Chen, Hunzaker and Lee2018; Chen et al., Reference Chen, Pacheco, Yang and Menczer2021) and more diverse in online tie formation (Conover et al., Reference Conover, Gonçalves, Flammini and Menczer2012; Boutyline and Willer, Reference Boutyline and Willer2017; Zimmerman et al., Reference Zimmerman, Bailey, Muric, Ferrara, Schöne, Willer and Halperin2024). But there are also mixed results. Mosleh et al. (Reference Mosleh, Martel, Eckles and Rand2021) show in a correspondence test involving artificial accounts fielded on Twitter that both liberal and conservative users, at roughly the same rates, were more likely to follow co-partisans. Bakshy et al. (Reference Bakshy, Messing and Adamic2015) report similar levels of network homophily among liberals and conservatives in observational data from US Facebook. In sum, the behavioral argument predicts that over- and underexposure to cross-cutting content arise when groups differ in their homophily preferences and thus form networks with unequal shares of outgroup ties, with the underexposed group displaying stronger homophily than the overexposed group.
A second explanation of the asymmetry puzzle is structural. Twitter in 2022 provides an interesting testing ground: as a predominantly liberal platform, it placed conservative users in the minority within the networks that disseminate online news content. Being in the minority naturally exposes conservative users to more liberal accounts than vice versa. While members of the majority group can easily find and follow other ingroup accounts, the odds for ingroup interactions are against minority members. As the sociologist Peter Blau famously argued, under equal ingroup preferences, minority members inevitably form a larger share of outgroup ties due to an asymmetry in opportunity structure (Blau, Reference Blau1977; Blau and Schwartz, Reference Blau and Schwartz1984).Footnote 1 More recent work has extended this insight beyond dyadic relations to the structure of social networks, showing analytically that homophily and group-size asymmetries produce disproportionate degree rankings that systematically disadvantage minorities (Karimi et al., Reference Karimi, Génois, Wagner, Singer and Strohmaier2018). The basic pattern of minority groups forming more outgroup ties has been corroborated by numerous empirical studies across a diverse range of social settings, from classrooms and workplaces to marriage markets (Ibarra, Reference Ibarra1995; McPherson et al., Reference McPherson, Smith-Lovin and Cook2001; Arvidsson et al., Reference Arvidsson, Collet and Hedström2021; Puur et al., Reference Puur, Rahnu and Tammaru2022). Due to this pattern, reduced homophily within the minority group broadens the ideological range of content that reaches them (for the link between homophily and exposure to novelty, see Granovetter (Reference Granovetter1973); Mark (Reference Mark2003); Aral and Van Alstyne (Reference Aral and Van Alstyne2011); Arvidsson, Hedström, and Keuschnigg (Reference Arvidsson, Hedström and Keuschnigg2025)). The structural argument predicts that a minority (conservative users) is overexposed to cross-cutting content, whereas the majority (liberal users) is underexposed to cross-cutting content because they can be narrower networkers and thus stricter curators of their profile feeds. As a result, a surprising number of conservative-leaning users follow and engage with liberal news media.
To test the explanatory power of the behavioral and the structural accounts, we combine observational data with simulated benchmarks obtained under different assumptions of the network-generating mechanism. In our empirical analysis, we use Barberá et al.’s (Reference Barberá, Jost, Nagler, Tucker and Bonneau2015) method to estimate the ideology of a sample of 420,000 politically active US-based Twitter users (egos), their network contacts (alters), and the media outlets standing behind the URLs that appear in egos’ profile feeds. Counterfactually rewiring ties among liberal and conservative users assuming different homophily preferences, we find, first, that substantial ingroup preferences are required to reproduce the observed asymmetric exposure pattern. Second, and most importantly, we find that simulated networks formed under equal levels of homophily preferences among liberals and conservatives reproduce the observed exposure asymmetry between the two groups. When we allow conservatives and liberals to differ in their homophily preferences, the simulation model performs no better at reproducing the asymmetry than the version with no behavioral differences. In other words, we do not need to make assumptions about differential behavioral tendencies in tie formation between ideological camps to reproduce the conservative media niche. Instead, we find strong evidence for the structural mechanism. But make no mistake, homophily preferences are required to bring about the phenomenon: without ingroup preferences, liberals and conservatives would have identical exposure to similar media diets. As such, behavioral tendencies also play a role—yet not in the hypothesized sense but as part of the structural account.
2. Background
Online platforms are in constant flux, influenced by changes in user demographics, ownership, and the algorithms that moderate content and user experience (Salganik, Reference Salganik2017; Hickey et al., Reference Hickey, Schmitz, Fessler, Smaldino, Muric and Burghardt2023; Washington Post, 2023; New York Times, 2024; The Guardian, 2025). Murthy (Reference Murthy2024) offers an engaging summary of Twitter’s history in a recent issue of the Annual Review of Sociology, describing its shift from a predominantly liberal platform after its launch in 2006 to a more conservative X in recent years. In fact, Musk justified the acquisition by citing alleged biases in the platform’s user base and in the visibility of political content; alongside claims that conservative viewpoints were marginalized, the takeover was framed as an effort to restore balance and empower a more genuinely democratic public (See, Reference See2025).
We study pre-acquisition Twitter data from July and August 2022, a data window that co-occurs with a number of trending issues and events in US politics. The Biden administration was in its second year, with ongoing debates over Covid-19, election integrity, and voting rights. In February, Russia’s full-scale invasion of Ukraine prompted widespread support for providing aid, before the issue became politicized. In June 2022, the Supreme Court overturned Roe v. Wade, sparking debates on reproductive rights and women’s health. Throughout the year, there was a notable surge in gun violence, fueling discussions on gun control, public safety, and mental health. The Black Lives Matter movement remained relevant, though its prominence had diminished since its peak in 2020. The country grappled with significant economic challenges, including inflation rates not seen in decades, which contributed to heightened discussions on workers’ rights, corporate responsibility, and economic inequality. In addition, issues like immigration, climate change, and the resurgence of Donald Trump informed political discourse on Twitter during the summer of 2022. During the 2022 study period, 72% of US adults said they were using social media, 22% reported using Twitter, and only one-third of US respondents viewed social media as beneficial for democracy, while two-thirds saw it as harmful, and 79% believed it exacerbates polarization (Pew Research Center, 2022, 2024).Footnote 2
3. Data and methods
We analyze a dataset of 420,000 US-based active Twitter users from July and August 2022. These users are considered politically active as they follow accounts of high-profile politicians and pundits. Additionally, users were required to have posted at least one politically relevant URL during April and May 2022, the months leading up to the study period. The dataset was collected through the Twitter API, using the access points for users’ timelines and lists of followers.
Our sampling strategy starts from a list of 962 politically relevant seed accounts including members of Congress and pundits identified from Wikipedia’s list of US political commentators (https://en.wikipedia.org/wiki/Category:American_political_commentators). To identify active seed accounts on Twitter, we manually searched Twitter for profiles that we could reliably link to the names in the Congress and pundit lists, prioritizing accounts that appeared highest in search results and had at least 5,000 followers. Then, using the Twitter API, we compiled a list of all followers of these 962 seed accounts, which constitutes our sampling frame. In a second step, we sample from users who meet the following criteria: (1) they follow at least 3 of the seed accounts, (2) have a public Twitter profile, and (3) follow between 100 and 5,000 accounts. In the study period, only verified accounts could follow more than 5,000 accounts. By capping the collection of user accounts at 5,000 followers, we aim to capture a sample more likely to be individuals than organizations, and laypeople than celebrities, that better represents the general population of US Twitter users.Footnote 3 This procedure results in a sample of 418,590 users, who serve as the “egos” in our analysis. We then collect egos’ following networks, finding 44,128,479 unique “alters” to whom the focal egos maintain ties. This results in ego-centered networks between approximately 420 thousand politically active Twitter users and the 44 million unique accounts they follow. To gauge the content shared between egos and their alters, we extract all posts containing URLs from the 300 most popular domains in our dataset. Among these, we manually classified 138 domains (46%) as news media outlets. These 138 domains constitute the basis for our analysis of political media content diffusion.
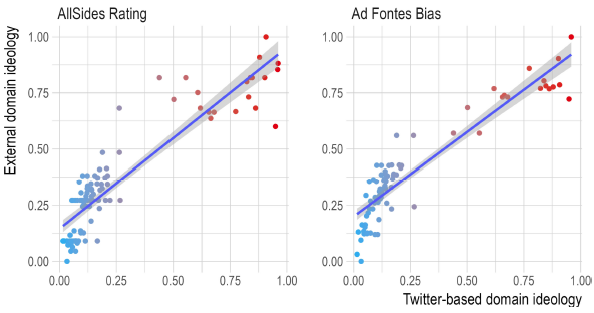
We use Barberá et al.’s (Reference Barberá, Jost, Nagler, Tucker and Bonneau2015) method to define the ideology of each of the focal users (egos), their network contacts (alters), and the media outlets standing behind the shared URLs of news stories which appear in egos’ profile feeds. We estimate ideology scores in three steps. First, we use a restricted set of seed accounts—members of Congress—and the most politically engaged egos who follow them to project their adjacency matrix into a latent ideological space. This approach rests on the assumption that following ties to political elites indicate ideological affinity. Replicating Barberá et al., we recover this space using correspondence analysis: we construct a matrix of standardized residuals from network ties and apply singular value decomposition to obtain a low-dimensional representation in which users with similar following patterns are located near one another. Second, we project political pundits as secondary seed accounts onto the same latent dimensions. Finally, we project the accounts of the remaining egos and alters into the same ideological space. This measure of political ideology does not naturally correspond with traditional survey measures of political leaning and lacks intrinsic interpretability of absolute values. Instead, it places users on a relative continuum based on the political leaning of their social connections. At the boundaries of this continuum are those accounts who only follow ingroup members located at the ideological extremes in their respective ingroups. The ideology scale can further be used to quantify the political valence of a domain based on the ideological composition of the users who engage with it. By analyzing the ideological positions of its users, we can project each media domain onto an ideological continuum. Our measure of domains’ political valence strongly correlates with established external benchmarks (AllSides, 2025; Ad Fontes Media, 2025): linear correlations are $r=0.90$
with the AllSides “Media Bias Rating” and
$r=0.90$
with the AllSides “Media Bias Rating” and $r=0.92$
with the Ad Fontes ``Political Bias Rating’’ (see Appendix A for details).
$r=0.92$
with the Ad Fontes ``Political Bias Rating’’ (see Appendix A for details).
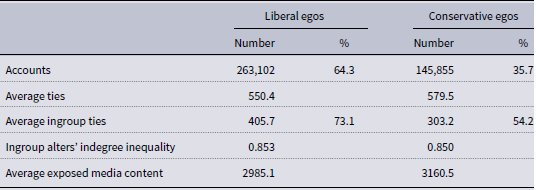
Table 1 describes the dataset from the perspective of users, classifying user ideology relatively to the New York Times: users to its right are considered “conservatives,” while those to the left are classified as “liberals.” We choose the New York Times as a cut-point for the binary user classification shown in Table 1, despite the fact that the outlet’s perceived ideological position is context-dependent and contested, and the external benchmarks mentioned above classify it as left-leaning. We use it as a cautious cut-point—one that facilitates rather than inhibits the falsifiability of our theoretical argument. This decision errs on the side of classifying many moderates as conservatives, rather than narrowing the conservative category to only those on the far right. Even with this threshold, users categorized as conservatives comprise only 36% of the sampled ego accounts in the 2022 Twitter dataset. Among other things, Table 1 shows that users classified as liberals or conservatives received roughly the same volume of potential exposures to media URLs through their network contacts, on average 2,985 and 3,161, respectively. See the results section for further interpretation of Table 1, and Appendix B for a version using a cut-point further to the right. Note that all remaining analyses rest on the continuous measure of user ideology, without applying any cut-point.
Description of the US Twitter dataset, July–August 2022

We classify user accounts as ‘liberal’ or ‘conservative’ if their ideology is left or right of the New York Times position. We use the Gini coefficient to quantify indegree inequality among the alters that egos of the same ideology follow.
The key quantity we extract from the data is potential exposure from network contacts—who brings whom into contact with media content. Following ties define each user’s network exposure, i.e., the full set of tweets from accounts they follow. This concept of potential exposure is analytically distinct from actual exposure, which would refer to the subset of content that ultimately appears on a user’s screen after platform-level ranking and filtering.
We combine these observational data with simulated benchmarks—obtained under different assumptions about liberals’ and conservatives’ homophily preferences—to explore the origins of the exposure asymmetry on Twitter. In the simulations, we artificially intervene in users’ ego-centered networks, manipulating what content reaches them. We then compare the fit between the observed network exposures and the simulated ones in three counterfactual conditions. The first is a baseline null model with no ingroup preferences in tie formation. In the second condition, we simulate networks under equal levels of ingroup preferences for liberals and conservatives, consistent with the structural explanation for the mainstream status of liberal media and the conservative media niche. In the third condition, the two groups differ in ingroup preferences, consistent with the behavioral explanation.
To this end, we simulate ego-centric networks following well-established methodology developed in previous homophily-centered studies (Karimi et al., Reference Karimi, Génois, Wagner, Singer and Strohmaier2018; Watts et al., Reference Watts, Dodds and Newman2002; Centola, Reference Centola2015; Zhao and Garip, Reference Zhao and Garip2021), but extend this approach by allowing ingroup preferences to vary across groups of egos. For every ego $i$
, the probability of forming a tie to alter
$i$
, the probability of forming a tie to alter $j$
is given by
$j$
is given by
 \begin{equation*} \begin{aligned} P_{ij} &= c \cdot \textrm{exp}(\!-\! \beta \gamma \eta ) \quad \text{and} \quad \eta = \left (\frac {q}{100}\right )^{k}, \end{aligned} \end{equation*}
where $\beta$
regulates the strength of homophily,
$\beta$
regulates the strength of homophily, $\gamma$
is the ideological distance between ego and alter,
$\gamma$
is the ideological distance between ego and alter, $c$
is a normalizing constant,
$c$
is a normalizing constant, $\eta$
controls the variation in homophily, and
$\eta$
controls the variation in homophily, and $q$
is the ideology percentile of ego. Homophily preferences are equal among conservatives and liberals when
$q$
is the ideology percentile of ego. Homophily preferences are equal among conservatives and liberals when $k = 0$
, and differential when
$k = 0$
, and differential when $k \neq 0$
: conservatives are more likely to form ingroup ties than liberals when
$k \neq 0$
: conservatives are more likely to form ingroup ties than liberals when $k \gt 0$
, whereas liberals are more homophilic for
$k \gt 0$
, whereas liberals are more homophilic for $k \lt 0$
. We implement the three homophily conditions as follows: zero homophily baseline:
$k \lt 0$
. We implement the three homophily conditions as follows: zero homophily baseline: $\beta = 0$
,
$\beta = 0$
, $k = 0$
; equal homophily:
$k = 0$
; equal homophily: $\beta \gt 0$
,
$\beta \gt 0$
, $k = 0$
; and differential homophily:
$k = 0$
; and differential homophily: $\beta \gt 0$
,
$\beta \gt 0$
, $k \neq 0$
. By comparing exposures in simulated networks under these three conditions to those in the observed networks, we can infer whether differential levels of homophily explain the observed asymmetry in exposure.
$k \neq 0$
. By comparing exposures in simulated networks under these three conditions to those in the observed networks, we can infer whether differential levels of homophily explain the observed asymmetry in exposure.
We measure the fit between simulated and observed exposures by comparing, for each user ideology percentile, the share of network exposures represented by each of the ten most liberal and ten most conservative domains in the simulated networks to those in the observed networks. We then average the absolute differences in exposure shares (simulated minus observed) across user ideology percentiles and domains, resulting in an overall measure of fit. We refer to this measure as the mean absolute error (MAE), with smaller values indicating better fit. In the equal-homophily condition, we search for the value of $\beta$
that minimizes error while holding
$\beta$
that minimizes error while holding $k=0$
. In the differential-homophily condition, both
$k=0$
. In the differential-homophily condition, both $\beta$
and
$\beta$
and $k$
are optimized.Footnote
4
Support for the structural argument would be indicated if the equal-homophily condition achieves a strong fit in absolute terms (i.e., reproduces the asymmetry) and performs no worse than the best-fitting differential-homophily condition. By contrast, support for differential homophily would be indicated if equal homophily fails to provide an adequate fit in absolute terms and/or if differential homophily yields a substantial improvement.
$k$
are optimized.Footnote
4
Support for the structural argument would be indicated if the equal-homophily condition achieves a strong fit in absolute terms (i.e., reproduces the asymmetry) and performs no worse than the best-fitting differential-homophily condition. By contrast, support for differential homophily would be indicated if equal homophily fails to provide an adequate fit in absolute terms and/or if differential homophily yields a substantial improvement.
Before presenting the results, we acknowledge several limitations that we revisit in the concluding section. These include our inability to differentiate supportive from critical engagement with cross-cutting content, reliance on domain-level rather than URL-level analysis, an exposure measure reflecting potential rather than confirmed exposure, and simulations that do not account for algorithmic curation. Nonetheless, as discussed later, these limitations do not undermine the key insights derived from our analysis.
4. Results
Figure 1 presents the ideology distribution of the 300 most popular domains shared by sampled Twitter users. Panel A focuses on the 138 news media domains among them, revealing a bimodal ideology distribution that highlights the polarization of news sources: the most shared content is dominated by clearly liberal (blue) and conservative domains (red), respectively, with conservative outlets clustering on the far right of the relative ideology scale. This level of polarization does not extend to other domains outside of news media, as shown in panel B, where domains such as Spotify, the Centers for Disease Control, and the scientific journal Nature are among the most widely shared. We still find bimodality for non-news-media domains, but there is no indication that any popular domains are exclusively shared by conservatives, as is instead evident in the long red tail of the ideology distribution for news media domains. In summary, polarization is a defining feature of news media on Twitter during the summer of 2022, but much less so of other domains.
Twitter’s conservative media niche: Distribution of ideological positions of (A) news media domains and (B) other domains shared July–August 2022. The projection of domain ideology considers shares of both ego and alter accounts. Ideology is relatively color coded, with blue indicating the outmost liberal domains in the sample, red for outmost conservative ones and a blend of red and blue for those in between. (C) Ideological distribution of the followers of the four most liberal (blue) and most conservative (red) news media domains as well as the New York Times and FoxNews as the most popular liberal and conservative news domains, respectively.

In panel C of Figure 1, we observe the ideological asymmetry where liberal news domains are shared across the ideological spectrum, while conservative outlets remain niche. The panel shows the distribution of shares for specific news media domains across users’ ideological ranks, where 1 represents the most liberal users, 100 represents the most conservative, and each percentile includes an equal number of users. This panel includes data for the four most liberal (top) and four most conservative news media domains (bottom). For contrast, we include the New York Times and Fox News, both of which, despite their ideological leaning, present a more moderate user composition. The asymmetry at the extremes is pronounced. Liberal domains are shared across a broad range of ideology ranks, including conservative users, as seen in the extended red right tails. By contrast, conservative domains are virtually never shared by liberal users as indicated by the narrow left tails. These domain-level snapshots present evidence of the conservative online media niche. The remaining analyses aim to explain this phenomenon, taking into account the fact that Twitter is organized as a network, where following ties shape content exposure.
Table 1 above describes the basic network features of our Twitter data. Despite following a roughly similar number of accounts on average (conservatives 580 and liberals 550), the share of outgroup ties is substantially larger for conservatives (46%) compared to liberals (27%). At the same time, we find a similar concentration in followership—how evenly following ties are distributed among liberal and conservative accounts—as indicated by Gini coefficients of 0.850 for conservatives and 0.853 for liberals (where 0 would indicate perfect equality, with every alter receiving the same number of followers, and 1 indicating maximum inequality with all followers concentrated on a single account).
Exposure makes the difference: Distribution of egos’ ideological positions who share (first rows) and are exposed to (second rows) content from the most liberal (blue) and most conservative (red) news media domains. On the y-axis, we plot the percentage of content users share and are exposed to against users’ ideology percentiles (x-axis). The plots to the right show an average over the 10 most liberal or conservative news media domains, respectively. The bottom rows show simulated exposure benchmarks for the condition of no homophily ( $\beta =0$
; transparent) and for the equal-homophily condition with
$\beta =0$
; transparent) and for the equal-homophily condition with $\beta =2$
(opaque).
$\beta =2$
(opaque).

Distinguishing between content users potentially encounter via their network contacts and the content they actually share, Figure 2 displays sharing and network exposure patterns for the four most liberal and four most conservative domains, along with an average over the 10 most liberal or conservative domains, plotted by egos’ ideology percentiles. We use the ideology scale in terms of ranks (or percentiles), ranging from 1 to 100, with 1 being the most liberal and 100 the most conservative egos, and each percentile including the same number of users. Comparing the plots in the top and middle rows, we observe a rather close correspondence between the sharing of political news content and potential exposure to such content through followed accounts. This result would seem to contrast with previous research (Bakshy et al., Reference Bakshy, Messing and Adamic2015; González-Bailón et al., Reference González-Bailón, Lazer, Barberá, Zhang, Allcott and Brown2023; Robertson et al., Reference Robertson, Jon, Damian, Katherine and ChristoWilson2023; Green et al., Reference Green, McCabe, Shugars, Chwe, Horgan, Cao and Lazer2025), which has highlighted ideological filtering in the exposure-to-engagement funnel. Our domain-centric result shows some degree of filtering for the most liberal domains, as seen in the difference between exposures and sharings in the highest ideology percentiles (the most conservative users). Similarly, the red left tails are more pronounced for exposures than for sharings when looking at conservative media domains. But altogether, filtering is of a relatively lesser importance; even without it, the asymmetry prevails. Part of it is that liberals are not even exposed to the most conservative content, leaving them no chance to filter at this stage. Instead, the clearest and most consistent pattern in Figure 2 is that conservatives are exposed to the most liberal domains (heavy right tails in the blue plots), while liberals are not exposed to the most conservative domains (narrow left tails in the red plots). For example, if we look at the exposures to the most liberal domain Democracy Docket, focusing on the users above the 90th ideology percentile, we see that a meaningful proportion of these most conservative users’ media exposures come from the most liberal outlet. By contrast, considering the most conservative domain, The DC Patriot, we see that virtually no liberals were exposed to it. These plots show asymmetry not only in sharing behaviors but also in exposures. The central question then becomes: why are liberals less exposed to cross-cutting content than conservatives?
The behavioral explanation suggests that this asymmetry arises from different sorting preferences between conservatives and liberals. To maintain greater exposure to cross-cutting content, conservative Twitter users would need to choose broader networks than liberal users. The structural explanation, by contrast, attributes the exposure asymmetry to the minority status of conservative accounts within the Twitter network. The network statistics presented in Table 1 provide possible credence to both accounts. On the one hand, we do find that conservatives maintain broader networks than liberal users (46% of conservatives’ alters are liberals, while only 27% of liberals’ alters are conservatives). On the other hand, it is also the case that there are more liberal users on the platform (64% vs. 36%), and we do not find any evidence of the minority group creating fewer ties or concentrating their ties on a more narrow set of ingroup users—which would be ways in which a minority could break the asymmetry in population structure.
Assessing empirical fit of simulated exposures on networks generated under varying assumptions about homophily in tie formation. Empirical fit is measured as the mean absolute error (MAE) between simulated and observed exposure shares of different domains, averaged across user ideology percentiles and domains. (A) Heatmap of empirical fit across a parameter space that includes the three homophily conditions: null model with zero homophily (strength $\beta = 0$
, balance
$\beta = 0$
, balance $k = 0$
), equal homophily in both groups (
$k = 0$
), equal homophily in both groups ( $\beta \gt 0$
,
$\beta \gt 0$
, $k = 0$
), and differential homophily (
$k = 0$
), and differential homophily ( $\beta \gt 0$
,
$\beta \gt 0$
, $k \neq 0$
). (B) The one-parameter equal-homophily model achieves better fit (lower MAE) than the two-parameter differential-homophily model in all simulations.
$k \neq 0$
). (B) The one-parameter equal-homophily model achieves better fit (lower MAE) than the two-parameter differential-homophily model in all simulations.

To adjudicate between the behavioral and structural accounts, we simulate ego-centric networks under different levels of homophily and assess the generative sufficiency of each model in terms of exposures. Figure 3 shows the fit between observed and simulated exposures across the specified conditions. The heatmap in panel A summarizes the fit for different combinations of homophily strength $\beta$
and differential homophily
$\beta$
and differential homophily $k$
. It shows that exposures generated on networks with higher
$k$
. It shows that exposures generated on networks with higher $\beta$
and lower
$\beta$
and lower $k$
resemble the observed exposures most closely (see also Appendix C). The fit between observed and simulated exposures declines when the overall strength of homophily preferences decreases (
$k$
resemble the observed exposures most closely (see also Appendix C). The fit between observed and simulated exposures declines when the overall strength of homophily preferences decreases ( $\beta$ $\rightarrow$
0) and when homophily preferences increase in one camp but not in the other (
$\rightarrow$
0) and when homophily preferences increase in one camp but not in the other ( $k$
$k$ $\neq$
0). The best-fitting models under the equal-homophily condition (
$\neq$
0). The best-fitting models under the equal-homophily condition ( $\beta \in [2,4]$
) outperform all models under the differential-homophily condition (panel B). This result is notable because the model that allows for unequal homophily preferences between groups is more flexible, optimizing two parameters instead of one, yet the equal-homophily model still provides the better fit.
$\beta \in [2,4]$
) outperform all models under the differential-homophily condition (panel B). This result is notable because the model that allows for unequal homophily preferences between groups is more flexible, optimizing two parameters instead of one, yet the equal-homophily model still provides the better fit.
The bottom rows of Figure 2 compare observed exposures to artificial exposures received in the simulated networks, focusing on the equal-homophily model ( $\beta =2$
;
$\beta =2$
; $k=0$
) and the null model (
$k=0$
) and the null model ( $\beta =0$
). In the absence of homophily preferences (transparent histograms), users follow others across the ideological spectrum in proportion to their population share, resulting in uniformly distributed exposures. By contrast, under the equal homophily model—where the probability of forming a tie with an alter of the same ideology as ego is 6.2 times greater than with an alter one standard deviation away in the ideology scale—the simulated exposures (opaque histograms) approximate the observed distributions well, reproducing the ideological asymmetry in exposure.
$\beta =0$
). In the absence of homophily preferences (transparent histograms), users follow others across the ideological spectrum in proportion to their population share, resulting in uniformly distributed exposures. By contrast, under the equal homophily model—where the probability of forming a tie with an alter of the same ideology as ego is 6.2 times greater than with an alter one standard deviation away in the ideology scale—the simulated exposures (opaque histograms) approximate the observed distributions well, reproducing the ideological asymmetry in exposure.
Together, the simulation results presented in Figures 2 and 3 demonstrate that assumptions about different homophily preferences between liberals and conservatives are not required to reproduce the observed exposure asymmetry. Instead, these results support the structural argument. Under no homophily in both camps, the asymmetry in exposure is lost—and with it the conservative online media niche. Under stronger homophily levels, both liberals and conservatives form more ties to ingroup members, but because of the asymmetry in the population structure, conservatives form relatively more ties to liberals (than liberals do to conservatives), making them overexposed to liberal content. In sum, it is not that users of different ideologies form ties in starkly different ways, but rather that Twitter’s ecosystem at the time explains the heavy liberal and narrow conservative tails. As such, our results challenge the centrality of behavioral explanations and give support to the structural explanation based on the underlying population composition and network structure.
5. Discussion
To explain the ideological asymmetry in online media—where liberal content diffuses across party lines while conservative outlets remain confined to a far-right niche—we reported differences in exposure to cross-cutting media in the 2022 Twitter network. We find that, being in the majority, liberal users can afford to be narrow networkers, while conservatives—compelled to form more outgroup ties—are more likely to be exposed to cross-cutting content. As a result, liberal-leaning media is shared across party lines, whereas liberal users overlook conservative media. Much like in schools where minority students form more outgroup friendships or in workplaces where individuals of the minority gender are compelled into relatively more outgroup interactions, our findings suggest that the asymmetry in media exposure on Twitter is driven primarily by structural constraints inherent to skewed group sizes, with ingroup preferences playing a necessary yet secondary role in shaping these dynamics. Our findings complement and extend upon prior theoretical work on minorities in networks. Karimi et al. (Reference Karimi, Génois, Wagner, Singer and Strohmaier2018) showed analytically and computationally that homophily and asymmetric group sizes produce disproportionate degree rankings, with minorities systematically disadvantaged in homophilic networks. We demonstrate that the same kind of structural mechanism can generate asymmetric media exposure.
We have highlighted the structural and homophily-driven nature of the conservative media niche, yet social-media algorithms may further modulate these dynamics. Lacking data on actual exposures, we have analyzed “network exposure”—the content posted by accounts a user follows—rather than “screen exposure,” which reflects the algorithmically filtered content that ultimately appears on a user’s screen. We acknowledge that algorithmic curation mediates between potential exposure and actual viewing, but studying this filtering layer lies beyond the scope of this paper. By focusing on the information environment that users themselves curate through their tie-formation decisions, we follow standard practice in the literature (Bakshy et al., Reference Bakshy, Messing and Adamic2015; González-Bailón et al., Reference González-Bailón, Lazer, Barberá, Zhang, Allcott and Brown2023). While we cannot fully exclude the possibility that algorithmic suppression of conservative content contributed to the observed patterns, we presented evidence that sharing behavior mirrors potential exposures (Figure 2). This suggests that the core asymmetry persists downstream in the engagement funnel—an outcome that would be less likely if algorithmic filtering substantially reshaped what users engage with relative to what their networks expose them to.
Nevertheless, in the background of our observational data, a layer of algorithms shapes how user feeds are organized. In principle, recommendation systems, ranking algorithms, and personalization features can either reinforce majority–minority asymmetries (for instance, by preferentially surfacing ingroup posts) or mitigate them (by deliberately inserting cross-cutting content). This can interact with the minority status of certain ideological groups in subtle ways: a platform designed to promote “variety” in user feeds might narrow the asymmetry by exposing majority users to more outgroup posts, whereas an algorithm that leans heavily on prior engagement patterns could deepen the existing exposure gap. Future research will connect to a growing body of work that examines how particular platform features and affordances—such as feed-ranking rules or link-recommendation systems—alleviate or amplify the structural forces that produce asymmetric information ecosystems (e.g., Karimi et al. (Reference Karimi, Oliveira and Strohmaier2025); Neuhäuser et al. (Reference Neuhäuser, Karimi, Bachmann, Strohmaier and Schaub2023)).
Several limitations circumscribe our results. First, we approximate two political camps, but given the fractionalization in US politics there are definitely more. Second, we cannot rule out the possibility that conservative users follow and share liberal news media to critique or ridicule it—which could inspire future research efforts. At the same time, the patterns we observe could be driven by what some call the idea that “truth has a liberal bias,” suggesting that liberal-leaning news stories, on average, line up more closely with facts (see, e.g., Garrett and Bond (Reference Garrett and Bond2021)). This could make liberal-leaning news more plausible, a feature that experimental research has shown to improve the ability of content to spread across ideological divides in partisan networks (Stein et al., Reference Stein, Keuschnigg and van de Rijt2023). Third, we analyze posts of media content aggregated to the domain level. Analyzing the sharing of individual news stories has been shown to more clearly flesh out ideological differences in news exposure and engagement (González-Bailón et al., Reference González-Bailón, Lazer, Barberá, Zhang, Allcott and Brown2023; Green et al., Reference Green, McCabe, Shugars, Chwe, Horgan, Cao and Lazer2025). Discrepancies between domain- and URL-level ideology measures diminish toward the ideological end-points (Green et al., Reference Green, McCabe, Shugars, Chwe, Horgan, Cao and Lazer2025), however, suggesting that our results—focused on these end-points —are likely to generalize to a URL-based analysis. Fourth, we have not given special attention to extreme users (for Twitter/X, see Baribi-Bartov et al. (Reference Baribi-Bartov, McDowell, Anderson, Sullivan, Marks and Lee2024)). The distributions of ideology and activity are both skewed, such that it is reasonable to expect disproportionate influence by extreme accounts. An interesting avenue for future research is therefore to consider whether the described ideological asymmetry is sustained by a broad population of Twitter users or brought about mainly by clusters of extreme accounts. Finally, different conditions of dyadic influence will be empirically relevant. For example, closer alters will exert greater influence than more distant ones, and alters whose views are not perfectly aligned with ego’s can increase exposure to novel ideas (Granovetter, Reference Granovetter1973; Mark, Reference Mark2003; Aral and Van Alstyne, Reference Aral and Van Alstyne2011; Arvidsson et al., Reference Arvidsson, Hedström and Keuschnigg2025). We also focused on first-order contacts and, of course, higher-order influences can be theorized, where the closeness of alters and the composition of the alters’ networks influence egos’ exposure to shared content. We invite future research to take up such investigations.
In retrospect, our analysis of 2022 Twitter captures a particular moment in time. A Pew survey conducted 2 years later, surveying X users posting about politics, found that 54% of conservative users cited feeling welcome as a major motivation, compared to 33% of liberals (Pew Research Center, 2024). This trend is likely to have intensified, and conservatives, at this point, can no longer be expected to remain in the minority position they held during our observation period. Rather, if relative group sizes change, one would expect minority/majority (dis)advantages to shift, which in turn might cause the once-constrained group to retreat into newly available ingroup clusters. This would imply a declining spread of news from liberal outlets among conservative audiences. While the concrete observations we analyze are historical, the mechanisms we study are general, making what we find in light of theory transportable to other platforms and periods. Shifts in group sizes rearrange exposure asymmetries in predictable ways. We encourage the use of multi-platform data—including emerging platforms like Bluesky or Threads—to validate whether similar structural constraints apply in contexts where the ideological majority differs or where features and affordances shape tie formation differently. In an evolving social media landscape, the fundamental structural insight remains: if an ideological group is small, it can rarely insulate itself fully and thus becomes disproportionately exposed to outgroup content.
Acknowledgments
We thank Julius Hehenkamp for research assistance.
Competing interests
None.
Data availability statement
The 2022 Twitter data and the code that support the findings of this study are available for download: https://github.com/PabloBelloDelpon/2025_online_media_niche. The replication package also includes sensitivity analyses and allows to conduct own robustness checks, alternative specifications of the computational analyses, and further exploration of the data.
Funding statement
This research was funded by grants from the Swedish Research Council (2018-05170, 2019-00245, 2013-7681, and 2024-01861). It was also supported by the Swedish Excellence Center for Computational Social Science, funded by the Swedish Research Council (2022-06611).
Ethical standards
The research meets all ethical guidelines, including adherence to the legal requirements of the study country.
Author contributions
All authors contributed equally to this research and are listed in alphabetical order. All authors approved the final submitted draft.
Appendix A. Validation of domains’ estimated political valence
Our follower-based measure of the ideological positions of news media domains maps well onto two established external benchmarks, the AllSides “Media Bias Rating” and the Ad Fontes ``Political Bias Rating’’. Both rate US online media content and reflect political bias rather than accuracy or credibility. AllSides ratings are derived from a combination of expert evaluations and blind surveys, in which participants assess content without knowledge of the source. The resulting political bias scale runs from −6 (left) to 6 (right). Ad Fontes uses trained analysts that rate articles prominently featured on the outlets’ websites. Their bias scale runs from −42 (left) to 42 (right). We were able to retrieve Allsides ratings for 101 out of 138 domains in our sample (73%). Ad Fontes rated 85 out of 138 domains (62%). Figure A1 speaks for the validity of the follower-based measure: the linear correlation is $r=0.90$
with the AllSides and
$r=0.90$
with the AllSides and $r=0.92$
with the Ad Fontes rating, respectively. For comparison, the correlation between the Ad Fontes and AllSides measures is
$r=0.92$
with the Ad Fontes rating, respectively. For comparison, the correlation between the Ad Fontes and AllSides measures is $r=0.93$
.
$r=0.93$
.
Political valence of news media domains. The panels show the relationship between our Twitter follower-based estimate of domain ideology (x-axis) and external measures of news media bias (y-axis). All three measures are min-max normalized to 0–1 scales. Each domain is a dot colored by its Twitter-based ideology score.

Appendix B. Alternative liberal–conservative cut-point for user data description
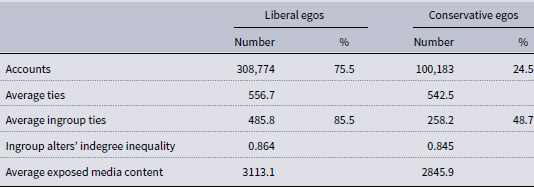
When describing the data in Table 1, we have used the New York Times’ ideological position as a cautious cut-point to classify Twitter users into conservatives or liberals. On the AllSides metric, the NYT leans left, with a rating of −2.2. We derive an alternative cut-point from the AllSides external ratings, choosing a large outlet in the center of their scale, The Wall Street Journal (slightly conservative leaning with a rating of 0.33), as an alternative cut-point for user classification. Table A1 is a version of Table 1, reported in the main text, based on this alternative left–right classification.
Alternative description of the US Twitter dataset, July–August 2022.

We classify user accounts as ‘liberal’ or ‘conservative’ if their ideology is left or right of the Wall Street Journal position. We use the Gini coefficient to quantify indegree inequality among the alters that egos of the same ideology follow.
As expected, cutting-off at a more conservative outlet increases the user share classified as liberals (up to 75.5% from 64.3% with the New York Times cut-point) and reduces the share of conservatives (down to 24.5% from 35.7%). This also increases the difference in the proportion of ties to ingroup members. By this classification, 85.5% of liberal egos’ ties are to other liberal users (up from 73.1%) while only 48.7% of conservative egos’ ties are to other conservative users (down from 54.2%). Importantly, under this alternative classification neither the number of ties is considerably lower in the minority group nor is the indegree inequality greater. Either would be a way for minority group members to avoid overexposure to cross-cutting content.
Note that the binary ideology classification only affects Table 1. The remaining analysis uses the continuous measure of ideology, either in its natural scale (Figure 1, panels A and B) or in percentiles (Figure 1, panel C; Figure 2).
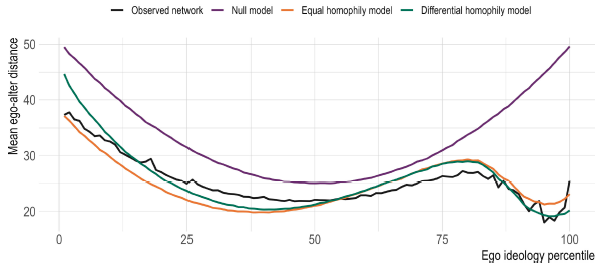
Appendix C. Comparison of simulated and observed networks
Figure A2 compares how closely the ego-centric networks generated under the three homophily conditions—no homophily, equal, or differential homophily preferences among conservatives and liberals—resemble the empirically observed ones on Twitter. We measure network fit as the absolute difference between egos’ ideological distance to their alters in the simulated and observed networks, averaged across ego ideology percentiles (MAE). Each model, again, is represented by the parameter values of $\beta$
and
$\beta$
and $k$
that best fit the simulated data (cf., Figure 3). The best one-parameter equal-homophily model (
$k$
that best fit the simulated data (cf., Figure 3). The best one-parameter equal-homophily model ( $\beta = 0.9$
and
$\beta = 0.9$
and $k = 0$
) provides better fit (MAE =
$k = 0$
) provides better fit (MAE = $2.03$
) than the null model (
$2.03$
) than the null model ( $\beta = 0$
and
$\beta = 0$
and $k = 0$
; MAE =
$k = 0$
; MAE = $8.06$
) and performs nearly as well as the two-parameter model with differential homophily (
$8.06$
) and performs nearly as well as the two-parameter model with differential homophily ( $\beta = 1$
and
$\beta = 1$
and $k = 0.3$
; MAE =
$k = 0.3$
; MAE = $1.61$
). At
$1.61$
). At $k = 0.3$
, a moderately conservative user (
$k = 0.3$
, a moderately conservative user ( $q = 75$
) is 2.5 times more likely to form a tie with a user of the same ideology than with a user 1 standard deviation away, whereas a moderately liberal user (
$q = 75$
) is 2.5 times more likely to form a tie with a user of the same ideology than with a user 1 standard deviation away, whereas a moderately liberal user ( $q = 25$
) would be 1.9 times more likely to form a tie of the same ideological distance. However, moving from the null model to the equal-homophily model accounts for 93% of the total improvement in fit, while adding the additional assumption of behavioral differences in ingroup tie formation contributes only at the margin (7%). This result provides further evidence that the asymmetry in media exposure is driven primarily by structural constraints inherent to skewed group sizes, with behavioral differences in ingroup preferences contributing only at the margin.
$q = 25$
) would be 1.9 times more likely to form a tie of the same ideological distance. However, moving from the null model to the equal-homophily model accounts for 93% of the total improvement in fit, while adding the additional assumption of behavioral differences in ingroup tie formation contributes only at the margin (7%). This result provides further evidence that the asymmetry in media exposure is driven primarily by structural constraints inherent to skewed group sizes, with behavioral differences in ingroup preferences contributing only at the margin.
Empirical fit of simulated ego-centered networks generated under varying assumptions about homophily. The black line shows the average ideological distance for observed ego-centered networks conditional on ego’s ideology. The colored lines show the corresponding values for simulated ego-centered networks—using the parameter configuration that minimizes MAE—under no homophily ( $\beta = 0$
,
$\beta = 0$
, $k = 0$
), equal homophily (
$k = 0$
), equal homophily ( $\beta = 0.9$
,
$\beta = 0.9$
, $k = 0$
), and differential homophily (
$k = 0$
), and differential homophily ( $\beta = 1$
,
$\beta = 1$
, $k = 0.3$
), respectively.
$k = 0.3$
), respectively.


 Open access