


Introduction
Previous models of the ice-ago cycle have been based on coupled energy-balance climate, bedrock response and ice-sheet components. Such models have exhibited some skill in predicting the geographic extent of glaciation in the Northern Hemisphere. However, major difficulties have arisen in connection with predicting the history of glaciation and deglaciation, especially concerning the fast dcglacialion events (terminations) that mark the end of each 100 000 year cycle. A number of hypotheses involving additional components and/or feedbacks that could be responsible for glacial terminations have been suggested and incorporated into modeling exercises. These have included: terrigenous dust-enhanced ablation (Reference Peltier and MarshallPeltier and Marshall, 1995), large-scale marine instabilities of the ice shed (Reference Peltier and MarshallPeltier and Marshall, 1995), changes in the thermohaline circulation (Reference Deblonde and PeltierDeblonde and Peltier, 1993), meltwater-induced calving into proglacial lakes (Reference PollardPollard, 1983) and snow-surface albedo changes due to snow ageing (Reference Gallé, van Ypersele, Fichefet, Marsiat, Tricot and BergerGallée and others, 1992). All of these plausible additional elements in a theory of the ice-age cycle have been incorporated into models in highly parameterized form. It remains unclear whether the difficulties encountered in replicating the ice-age cycle might be more likely ascribed to inappropriate mass-balance para- meterizations, erroneous climate model characteristics, or even to the numerical methods and theoretical simplifications employed to describe ice-sheet dynamics.
Reduced models of the climate system of the kind that have been employed in this previous work can provide constraints on the mix of climatic processes required to explain the ice-age cycle. As they are tuned to present climate, such models make the lest assumption that no major climate-system re-organizations (aside from direct changes in radiative forcing and in heat capacities due to the presence or absence of land ice) are required to retrodict the last ice-age cycle. Separate processes, such as changes in the thermohaline circulation, can then be added and assessed for their impact on ice-sheet evolution. However, there is clearly danger in simply adding extra components to simplified models of this kind, where flaws might occur due to inadequate treament of the processes already contained. An examination of the coupled model of Reference Deblonde and PeltierDeblonde and Peltier (1991), to be summarized herein, has led to the identification of significant problems with both the energy-balance climate component and mass-balance paramelerizations employed in the model. In the following sections of this paper we will discuss the modifications that we have made to this previous model to correct these deficiencies, and will compare the predictions of the ice-age cycle using the modified structure to the constraints provided by the SPEC-MAP δ18O record (Reference Imbrie, Berger, Imbrie, Hays, Kukla and SaltzmanImbrie and others, 1981), based on deep-sea sedimentary cores that (properly calibrated) provide a proxy history of eustatic sea-level variations, and the ICE-4G reconstruction of land-ice thickness variations (Reference PeltierPeltier, 1994) based on the deconvolution of relative sea-level histories. These comparisons will provide a clearer test as to whether new climate-system components are required to explain the full glacial cycle, or whether inadequate treatment of processes already contained are responsible for the past difficulties experienced in modelling the glacial cycle, especially the fast terminations.
Large-scale coupled models of the glacial cycle have generally used simplified representations of bedrock dynamics and ice-sheet model (ISM)/mass-balance spatial resolutions of 1–2° in latitude and longitude. In the final sections of this paper, we discuss model sensitivity to the spatial resolution of the mass-balance and ice-dynamics components and also the impact of incorporation into the model of a global, gravitationally self-consistent treatment of viscoelastic bedrock adjustment.
Model Description
The first element of the coupled model that we will review here consists of a one-level non-linear spectral energy-balance model (EBM) with realistic geography and an interacting vertically isothermal mixed-layer ocean, assumed to be 75 m deep (Reference Deblonde, Peltier and HydeDeblonde and others, 1992). The EBM employs wave number 11 triangular truncation corresponding to a spatial resolution of approximately 1800 km. Single-Iexel EBMs rely on the assumption that sea-level temperature T is linearly related to lower-tropospheric mean column temperature. The change in energy content of the tropospheric air column and oceanic mixed layer is taken to be given by the difference between the energy-input (absorbed solar insolation, S (with orbital parameters computed after Reference BergerBerger (1978)), and parameterized North Atlantic heat flux, NAHF}, the vertical longwave emission A + BT and horizontal diffusion of energy as:
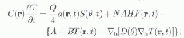
The diffusion coefficient (D) is tuned to preserve the present-day observed mean latitudinal temperature gradient, while Q is the solar constant (1360 Wm −2).
The albedo a(r, t) is computed seasonally to take into account changing snow and sea-ice lines, which, because of their temperature-dependence, render the model non-linear. Model heat capacities C(r) for the individual surface types are time-independent. Gridpoint heal capacities are updated to the value for land ice when glacial ice appears at the gridpoint. The control parameters of the EBM are fixed by timing to the present-day climate (Reference North, Mengel and ShortNorth and others, 1983). The model is therefore based upon the assumption that no major changes occur in meridional transport processes or atmospheric radiative response even when the system is perturbed by the development of large continental ice sheets.
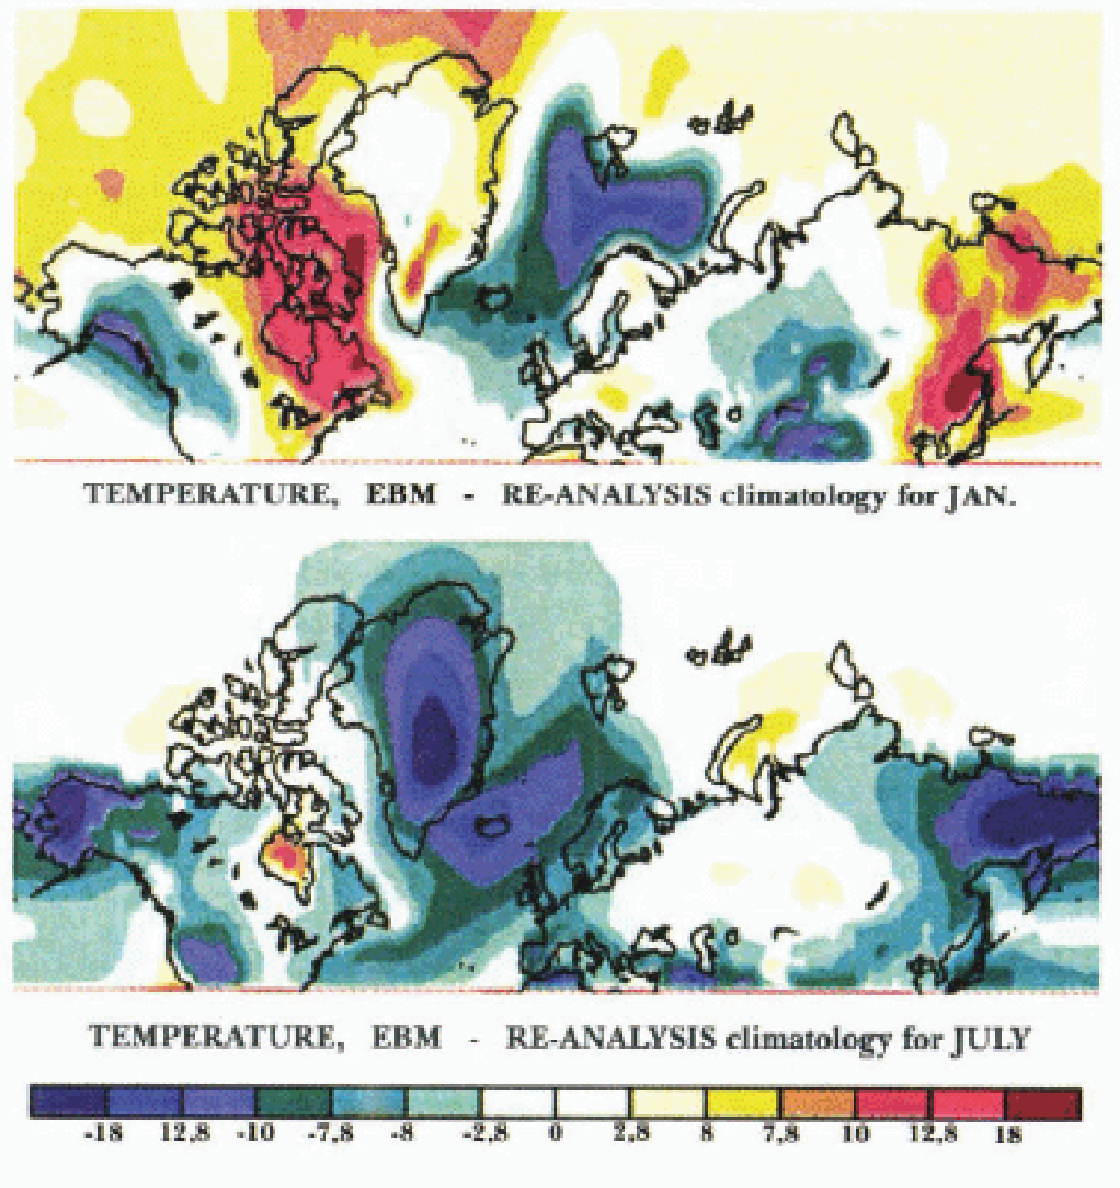
The linear version of this EBM (with seasonally fixed albedos) has been carefully validated against a general circulation model (GCM) for ice-age conditions (Reference Hyde, Crowley, Kim and NorthHyde and others, 1989). Its strength lies in its ability to estimate the response of the system in the extratropics to radiative perturbation, and it is therefore well suited for studies of the high-latitude climate response to orbital forcing. It is, however, a relatively low-resolution model, and its lack of explicit atmospheric dynamics (especially westerly advection over the northern continents) and oceanic general circulation, as well as its crude representation of the NAHF and sea ice, result in major discrepancies between a priori temperature-field predictions made with it and observations (Fig. 1). Key discrepancies include: (i) overly warm Arctic regions, especially in winter, (ii) eastern continental temperatures that are too hot in winter and too cold in summer, (iii) cold western North American (NA) and Norwegian/Greenland sea regions, and (iv) the overly warm Hudson Bay region.
Tempaalure difference (°C) between EBM at t = 0 ka before present and ECMWF re-analysis climatology
In order to correct these major errors and to exploit directly the model’s strength, the EBM is employed in a perturbativc mode. That is to say, it is now used to predict only variations from a high-resolution (T62) present-day opera-tional climatology (based upon a 14 year mean (1982–95) of re-analysed European Centre for Medium-Range Weather Forecasts (ECMWF) 2 m monthly mean temperature fields, ds090.0 (National Meteorological Center (NOAA)/National Center for Atmospheric Researeh (NCAR) global re-analysis project dataset). The EBM is therefore not employed to predict the basic climate stale itself. As we will show, this major modification of the modeling strategy from that previously employed leads to a marked improvement in the match between model output and the geological record.
The ice-sheet model employed in this work is based on the shallow-ice approximation with internal deformation undiffrerentiated from basal sliding (e.g. Reference Oerlemans and van der VeenOerlemans and Van der Veen, 1984). The change in ice thickness H is therefore determined by solution of a non-linear diffusion equation:
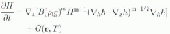
in which h is the surface elevation, ρ i is the density of ice, g is the acceleration due to gravity and G is the mass balance. the flow parameter, B = 9.0 m−3/2 a−1, is treated as a timing parameter for matching the aspect ratio of the Laurentide ice sheet with that of the ICE-4G reconstruction. This might be taken to be required by the absence of an explicit treatment of soft-bed dynamics in the ISM (e.g. see Reference Clark, Licciardi, MacAyeal and JensonClark and others, 1996). Numerical and theoretical details of the ISM hav e been thoroughly described elsewhere (Reference Deblonde and PeltierDeblonde and Peltier, 1991). The standard-model resolution has been increased from 1° to 0.5° in both latitude and longitude in the work to be described here. The source topography required for the ISM and for determination of the surface mass balance has also been updated to the ETOPO5 dataset (NCAR), with 1/12° resolution in both latitude and longitude.
Major modifications have also been made to the methodology employed to determine mass balance itself. The ablation parameterization, in particular, has been modified to two-level positive degree day (PDD) formalism (Reference Huybrechts and T’siobbelHuybrechts and T’siobbel, 1995). A normal statistical model with standard deviation σ = 5.5°C accounts for variations of daily mean and diurnal temperatures around the monthly mean temperatures from the climate model. The melting rate is set proportional to the annual sum of PDDs, with melt factors for snow and ice of 3.0 and 8.0 mm (ice equivalent) PDD−1, respectively. A fraction “pmax” = 0.6 of the snowmelt is assumed to refreeze to superimposed ice. Snow is melted first, then remaining PDDs are used to melt superimposed and old ice. The parameter values employed in this scheme match those of Reference Huybrechts and T’siobbelHuybrechts and T’siobbel (1995), aside from their choice of σ = 5.0°C.
The determination of monthly means of precipitation is very problematic, even for GCMs. As a first approximation, t he assumption of constant relative humidity has been found to hold in GCM studies on a hemispherically averaged basis (Reference RindRind, 1986). We therefore follow Reference Huybrechts and T’siobbelHuybrechts and T–siobbel (1995) in perturbing a present-day monthly climatological precipitation field (Reference Legates and WillmottLegates and Willmott, 1990) by a factor “hpre = 1.03” for each degree change (from the present-day value) in atmospheric column (i.e. sea-level) temperature. This exponential form is an approximation to the Clausius–Clapeyron equation. In addition, the elevation/desert effect of Reference Budd and SmithBudd and Smith (1987) is included, as it was in the previous integrations that have been performed with the model.
Determination of the rain/snow fraction of precipitation is also carried out with a normal statistical model to parameterize the fraction of precipitation occurring with surface temperatures below a value RS°C, taken here to be 0°C. A lower std dev. σpDD − 1°C = 4.5°C accounts for the reduced variability of daily temperatures during cloudy days when precipitation occurs.
An assumed lapse rate of 7.5°C km−1 is employed to adjust sea-level temperatures from the climate model to surface temperatures for the purpose of the computation of ablation and rain/snow fraction. It is well known that lapse rates vary seasonally, geographically and with altitude. However, the few parameterizations available for more detailed lapse-rate determination are tuned to zonal averages and fail to take into account the particular conditions around and on ice sheets (Reference RennickRennick, 1979).
The energy-balance model is coupled to the ice-sheet model via ablation, precipitation and rain/snow fraction dependencies on surface temperature. The ISM then feeds back to the EBM via changes in surface albedo and heat capacity in accordance with the presence or absence of ice at the gridpoint.
A radiative feedback from the ISM Io the EBM also occurs. Elevated ice surfaces are colder (i.e. because of the assumed vertical lapse rate) and therefore emit less longwave radiation. To account for this, the longwave radiative parameter in the energy-balance equation is adjusted to the lapse-rate corrected surface temperature. Previous analyses have demonstrated this to be a significant process (Reference Deblonde and PeltierDeblonde and Peltier, 1991).
One other radiative correction that is incorporated into the model is that due to changes in atmospheric CO2 concentration. This additional forcing is assumed to have the following logarithmic dependence on the partial pressure of CO2 (Reference Ramanathan, Liou and CessRamanathan and others, 1987), expressed in terms of the modification ΔA to the parameter A in the representation of the infrared emission (Equation (1)):

with
 ,
,
 Atmospheric CO2 concentration as a function of
time is now assumed to be fixed by the detailed Vostok ice-core time series
(Reference JouzelJouzel and others, 1987).
Atmospheric CO2 concentration as a function of
time is now assumed to be fixed by the detailed Vostok ice-core time series
(Reference JouzelJouzel and others, 1987).
A common problem that has been encountered consistently in coupled models of the ice-age cycle is the prediction of the growth of ice cover over Alaska. There is no evidence of large-scale glacialion in this region. The fact that previously constructed reduced climate-system models have predicted continental ice-sheet growth over Alaska is likely to be due to a combination of regional climate details and inadequate model resolution. The numerical topography, for example, replaces the sleep mountain peaks and deep valleys with a relatively high-elevation plateau. To avoid adverse impact on the climate that the erroneous nucleation of Alaskan ice would produce, ablation in this region is set either to the computed ablation or accumulation, whichever is larger.
The influence of ice shelves has not been incorporated into the model for the purpose of the present work. For simplicity, the ice sheets are assumed to expand on to the continental shelves to the 400 m bathymetric contour (present day), beyond which calving is assumed to be complete. As the extent of the Greenland ice sheet is strongly constrained at present by steep bathymetric perimeters and because its variation through the last ice-age cycle is assumed not to have been significant, we have not included a description of its dynamic behaviour in the results presented below.
New Simulations of the Ice-Age Cycle
A comparison of eustatic sea-level histories delivered by our new simulations of the ice-age cycle with those inferred on the basis of the SPECMAP δ18O curve (Reference Imbrie, Berger, Imbrie, Hays, Kukla and SaltzmanImbrie and others, 1984), scaled to an LGM eustatic change of 105 m as per the ICE-4G reconstruction of Reference PeltierPeltier (1994), demonstrates (Fig. 2) the major improvement that the use of the EBM in perturbative mode delivers (identified by “Wbase”). In interpreting these results, it is important to understand that the Southern Hemisphere glacial cycle has been fixed to one that is similar to ICE-4G with the Eemian to the Last Glacial Maximum (LGM) part of the cycle assumed to be linear, but with the net contribution to eustatic sea-level change at the LGM fixed to 16 m rather than to the slightly larger 21.8 m of ICE-4G. Except for the insufficiently intense (or absent) precessional (and obliquity) forced variations, agreement is quite close. Incorporation of proper marine components into the ISM and mass-balance determination would likely allow a weaker ablation parameterization while still effecting full termination. Weaker ablation would not only promote faster early growth of the ice-sheet but also reduce the excessive rate of deglaciation in the model. The latter half of the deglaciation event in the reduced ablation run (Wbase5 in Fig. 2) does achieve closer correspondence with the SPECMAP curve. However, the reduced ablation run shows little improvement for the −110 ka peak. Aside from possible contributions from Antarctic ice (that are not explicitly included in the model), the −110 ka discrepancy points to climate and/or mass-balance related inadequacies in the coupled model (e.g. lack of atmospheric circulation dynamics that could induce major changes in precipation). The complete glacial terminations effected by the model are nevertheless clearly evident and our success in this regard is the main new result reported in this paper.
Eustatic sea-level change. Includes an assumed Antarctic contribution of 16m at −21ka. Wbase5 has σ = 5.0°C. The case labelled “non-perturbative” uses the EBM directly to predict the surface temperature field (as opposed to deviation from the “observed” ECMWF re-analysis climatology) and uses the same mass-balance formulation as Wbase, though returned for the closest match to Spec-map. “Non-perturbative, old” uses reduced precipitation, 1° ISM resolution and altered heat capacities in the Bering Strait region as in Reference Peltier and MarshallPeltier and Marshall (1995).
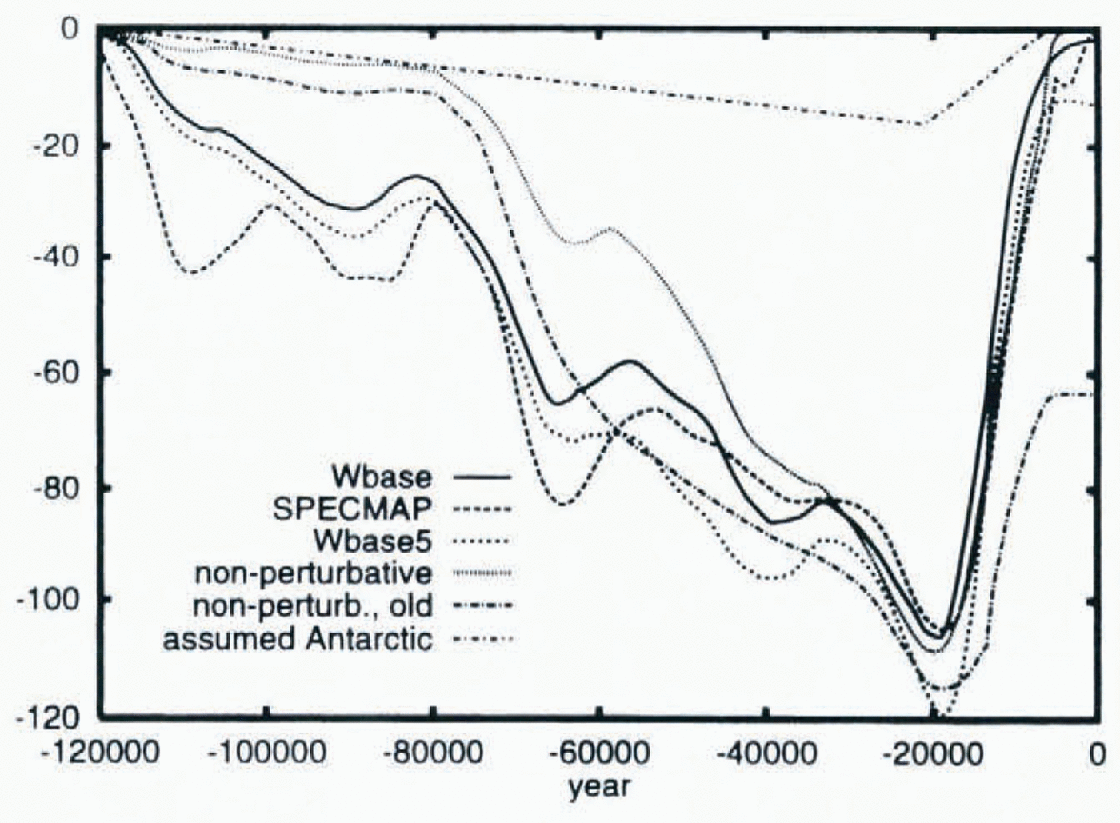
With the aforementioned changes to the mass balance, model resolution, updated-input datasets and CO2 forcing, full deglaciation is also achievable using the EBM in non-perturbative mode (case “non-perturb.”; Fig. 2). However, the delay of NA glacialion until post −80 ka is a major discrepancy. Further changes towards the prior configuration of the model (reduction of computed precipitation by 8%, retuning of the ablation for near ICE-4G LGM volumes, altered heat capacities in the Bering Sea region (as in Reference Peltier and MarshallPeltier and Marshall, 1995), and the use of 1° ISM resolution) leads to a complete loss of NA deglaciation (non-perturb.; old of Fig. 2) and thus to recovery of the problem we have solved here.
The use of the EBM in perturbative mode results in major changes in ice topography in the Eurasian (EA) sector (Fig. 3). The central and eastern sectors of EA are now in much better agreement with the ICE-4G model. Apart from the improvement in the location of the southern margin of the ice sheet, the Laurentide sector LGM ice topography changes very little with the change in climate-model formulation. Tuned for a specific LGM ice volume, model Laurentide ice topography is largely controlled by ice-flow dynamics and the location of the margin. In turn, apart from the southern edge, ice-sheet margins are controlled by bedrock topography and marine dynamics.
Ice thicknesses (m) at −20 ka for the non-perturbative model. ICE-4G and the perturbative model
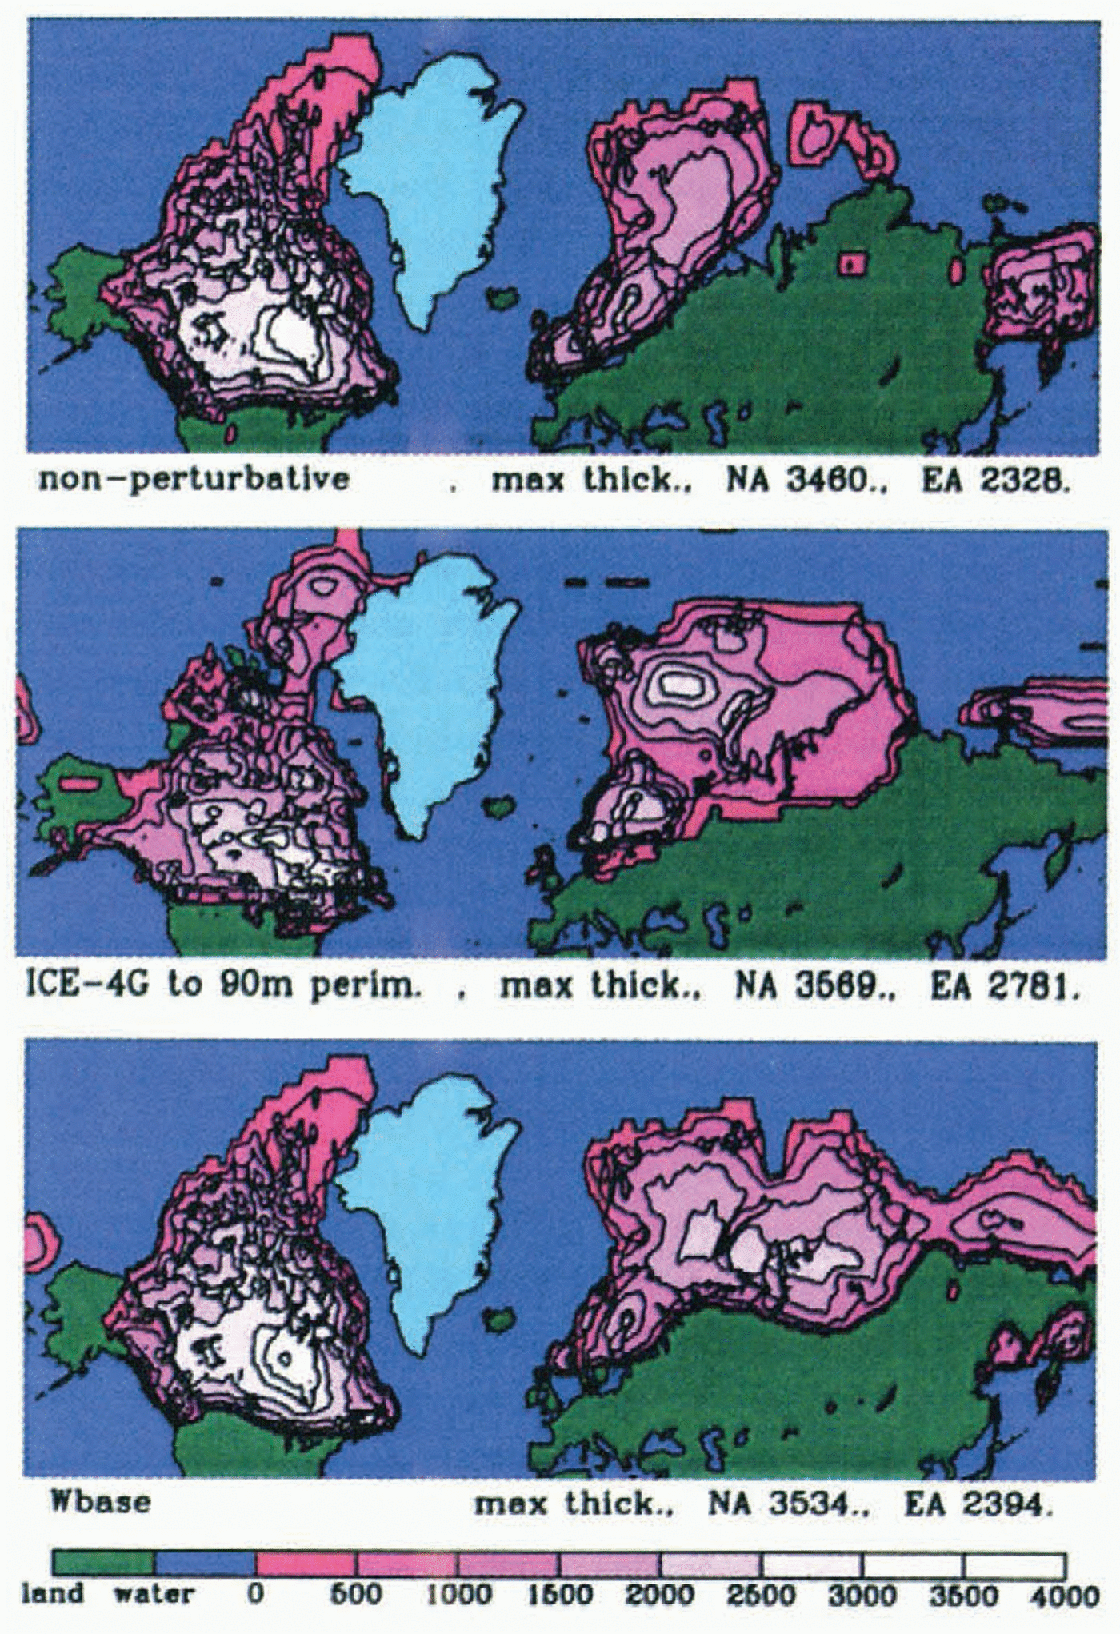
The most apparent disagreements between the base case (Wbase) and ICE-4G (Fig. 3) are insufficient southward penetration of the ice sheets into the southeastern United States and northern Europe, the linking of the east Siberian Sea ice sheet to the Kara Sea ice sheet, and dome location over the Barents Sea. We expect that these disagreements are due to processes not accounted for in the model rather than to inadequate treatment of those that are acrounted for.
GCM studies of ice-age climates indicate increases of precipitation in the southwestern margin of the Laurentide ice sheet due to displaced slorm tracks (Reference Kutzbach and GuetterKutzbach and Guetter, 1986). Increased precipitation would have increased regional mass balance and promoted southward penetration. Preliminary work with an ice volume-dependent enhancement of precipitation in the southeastern margin has been unable to extend this margin significantly. Therefore, sub-glacial processes involving the deformable tills in the region will likely also need to be incorporated into the model for a full explanation of the southeastern lobe (Reference AlleyAlley, 1991).
Disagreements in the northern European sector are likely related to the complexities of the dependence of the climate in this region on NAHF and sca-ice cover. Changes in effective regional heat rapacities due to expanded sea-ice cover would have lowered summer temperatures and thereby promoted expanded glacialion. Northern European climate is generally quite complicated. Prevailing winds change with the season and GCM simulations disagree on the general wind patterns during the LGM (Reference Lautenschlager and HerterichLautenschlager and Herterich, 1990; references therein). Accurate representation of the climate in this region will be a challenge.
Discrepancies in the marine components of the EA ice sheet are likely due to the absence of detailed marine ice dynamics and mass-balance parameterizations as well as subglacial processes involving highly deformable marine sediments (e.g. see Reference Clark, Licciardi, MacAyeal and JensonClark and others, (1996), for a discussion of the importance of this influence in the NA sector).
The appearance of ice on the plateau of far eastern Siberia is quite robust with different model parameterizations. T42 GCM studies (Reference Dong and ValdesDong and Valdes, 1995) also find that this region nucleates ice cover more easily than Fenno-scandia. If there were actually no glaciation in this region, two processes might account for this. A large-scale climatic re-organization not captured by the T42 GCM might have taken place. Otherwise, as we have hypothesized for Alaska, accurate mass balance and ice dynamics in this region may require mesoscale modelling.
There are a number of significant agreements between model-predicted placements of the main ice domes and inferences from the sea-level record. For example, there is a very close match for the main dome over Fennoscandia. The Wbase dome over the Hudson Bay has its centre displaced slightly southeast of its ICE-4G counterpart. ICE-4G has a dome over southeastern Quebec/Labrador, which only appears as a plateau in the Wbase prediction. The lack of significant ice buildup over the far northern region in the base model arises from the small area and steep topography of the region with three sides constrained by bathymetric calving. Inclusion of dynamic ice from Greenland and a smaller value of the flow parameter in this cold region would bring the model results more in line with IGE-4G.
Comparisons of the deglaciation sequences in Figure 4 indicate significant differences in timing between the predictions of the coupled model and ICE-4G. In NA, Wbase deglaciales too quickly in the eastern sector and too slowly in the western sector. Wbase has significant residual mid- to high-Arctic ice at −8 ka while ICE-4G has only residual ire on the Baffin Island plateau. The EA sector deglaciates too quickly in Fennoscandia and too slowly in the marine regions.
Deglaciation history to – 8 ka for Wbase
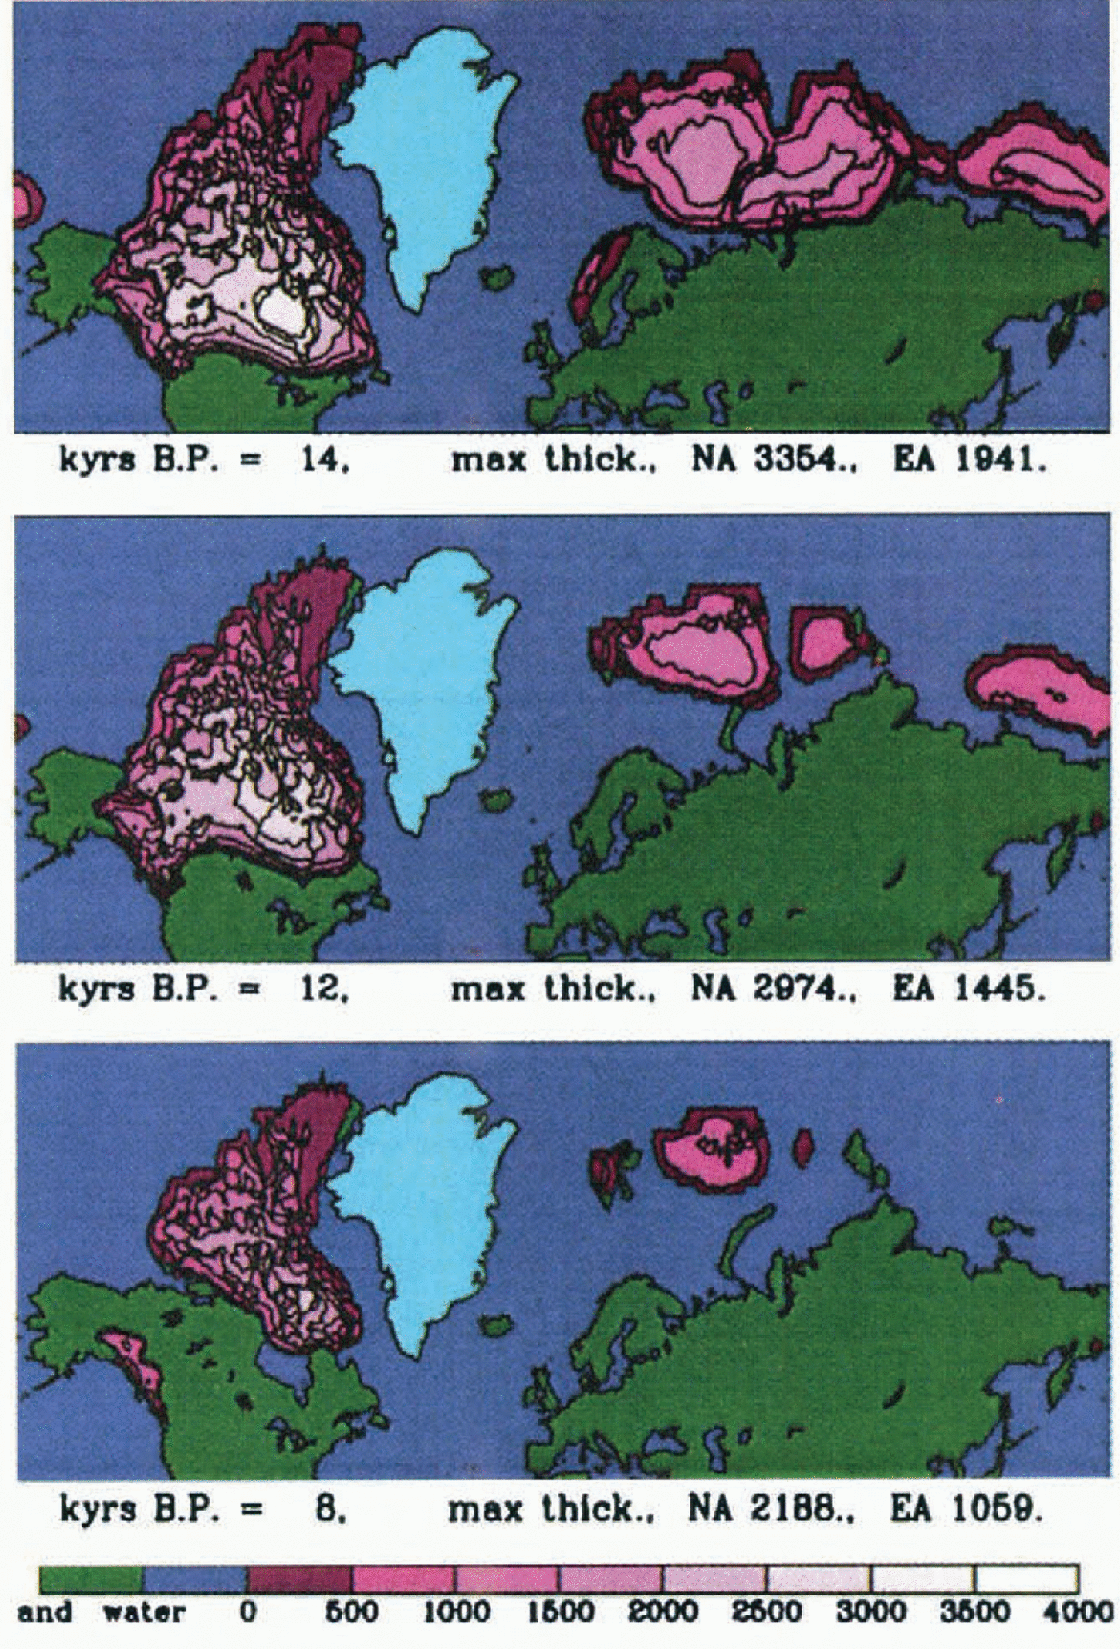
To summarize this section, major improvements in Northern Hemisphere ice-sheet evolution have resulted from the previously described changes to the climate and mass-balance components of the coupled model of the ice-age cycle. However, our results suggest that removal of remaining discrepancies will likely require improvements to and incorporation of: marine ice dynamics, subglacial processes and thermodynamic impacts on the ice dynamics itself. Improvements in climate modelling might be critical in the Fennoscandian, East Siberian and mountain range (Alaska and Cordillera) sectors.
Mass-Balance and Resolution Sensitivities
Although mass-balance parameters have been assumed fixed in the above-described analyses, the question regarding the adequacy of our representation for ice-sheet evolution remains. In an attempt to constrain the relative impact of possible dependencies, we have carried out a series of simulations with mass-balance parameters at their range limits. These limits have been compiled on the basis of a survey of the current literature (e.g. see Reference BraithwaiteBraithwaite, 1995; Reference Jóhannesson, Sigurdason, Laumann and KennettJóhannesson and others, 1995). The results from these analyses are given in Table 1.
LGM ice-sheet volume response to parameter limits
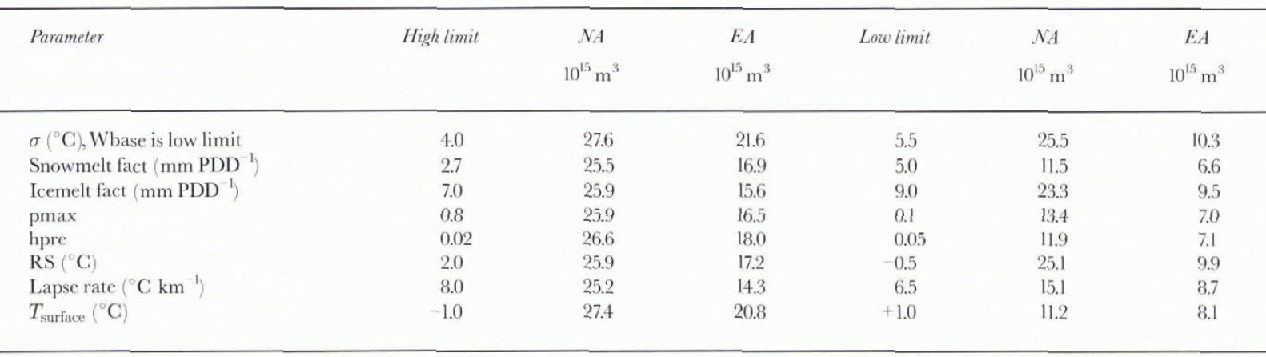
It is evident by inspection of these results that no parameter is particularly well constrained relative to its impact on the results of the simulation. With the given range limits, all mass-balance parameter uncertainties are of the same order. What is more interesting is that the continents have differing sensitivities to the sign of the mass-balance change. EA ice is very sensitive to increases in net mass balance and only moderately sensitive to decreases. In contrast, NA ice will peak earlier in response to an increase, but is unable to expand much beyond 27 × 1015 m3 in volume. NA is, however, quite sensitive to decreases in net mass balance. In relation to surface-temperature changes, the last entry in the table shows that mass-balance uncertainties are of the same order in their impact as would be caused by a perturbation of the mean monthly surface temperature by 1°C.
Strong mass-balance sensitivities combined with crude representations of highly complicated ablation and precipitation processes imply that one must tune to obtain reasonable LGM volumes. However, the actual details of the mass-balance parameterization are not especially significant. Any single mass-balance parameter can be set to its range limit and, with retuning of the remaining parameters, similar time scries and ice topographies can be obtained.
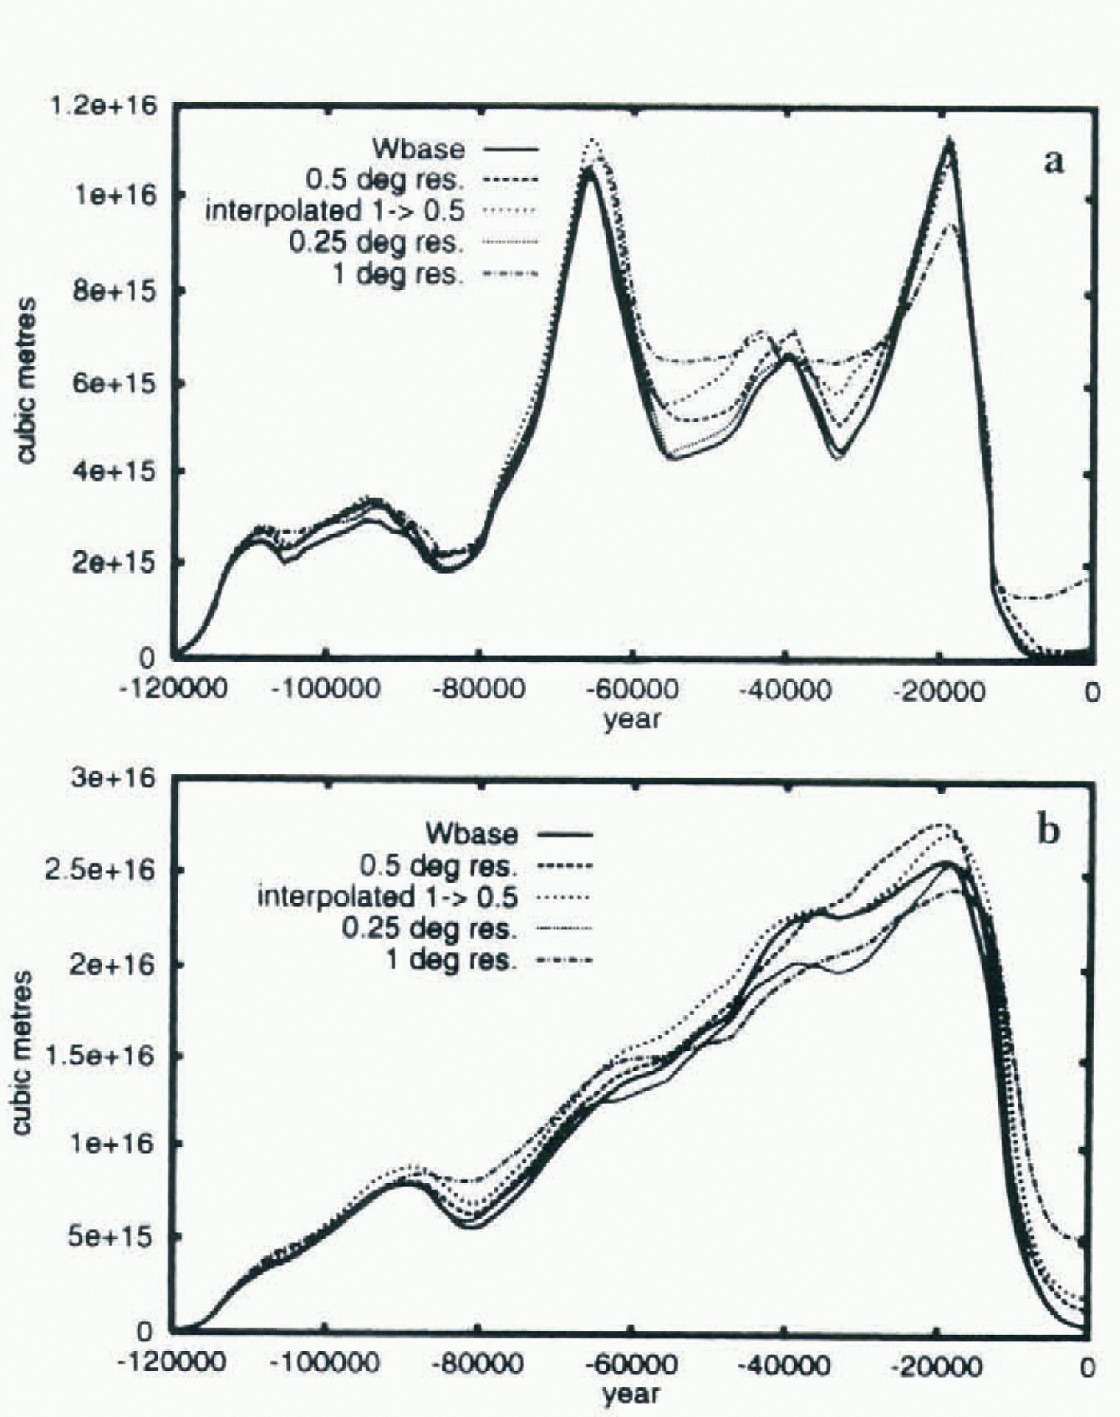
Discretization of analytical equations introduces errors, especially in non-linear systems. The ablation zones of the ice sheets are generally only a few gridpoints across and mass balance and ice dynamics are most sensitive in these regions. With the current configuration of the coupled model, a significant difference exists between 1 and 0.5° (latitude and longitude) resolution (Fig. 5). Especially significant is the order 4 ka delay in the deglaciation of North America and the smaller amplitude of the ice-volume signal that the model predicts with 1° resolution. Comparison with runs using an interpolated version of the 1° topography (Fig. 5) indicates that the numerical discretization of mass balance and ice flow is largely responsible for significant differences and not the higher-resolution topography. The increase in resolution, from 0.5° to 0.25°, has a smaller effect and could be compensated for by a change in mass-balance parameterization and flow parameter. In non-perturbative mode, the differences between results obtained with different model resolutions can be much larger. Using the model configuration of Reference Deblonde and PeltierDeblonde and Peltier (1993) with the updated mass-balance determination and topography, fairly strong deglaciation at 0.25° resolution in NA was completely absent at 1° resolution (not shown).
NA (a) and EA (b) ice-volume sensitivity to ISM resolution. (Aside
from Wbase, all runs use 0.25° resolution, lapse rate = 6.5°C
km−1 and flow parameter
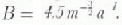 . Interpol. 1→ >0.5 is the result for the
simulation based upon the use of 1° topography interpolated to 0.5°
resolution
. Interpol. 1→ >0.5 is the result for the
simulation based upon the use of 1° topography interpolated to 0.5°
resolution
Bedrock Models
Previous versions of our model of the ice-age cycle have always employed a simple local-damped return to isostatic equilibrium with e-folding time τ = 3 ka (τ = 5 ka in this paper only) for the computation of bedrock response (h′) to ice loading:
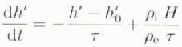
in which ρ i and ρ e are, respectively, the average densities of ice and mantle. However, much more realistic viscoelaslic bedrock models are non-local and have relaxation times dependent on the spatial scale of the ice load. We have therefore added a global bedrock-response model based on the gravitationally self-consistent theory of relative sea-level change that was used to infer the ICE-4G deglaciation history (Reference PeltierPeltier, 1994).
In this detailed theory, the relative sea level, S, is given by the time-dependent vertical separation between the ocean surface G (the geoid) and the surface of the solid Earth R, as:
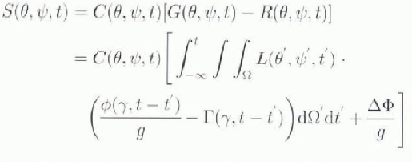
in which ϕ and Γ are, respectively, visco-elastic, surface-load Green’s functions for the gravitational potential perturbation and for the radial displacement induced by a point load. The “ocean function” C is unity where there is ocean and is zero elsewhere. The space-independent term. ΔΦ(t)/g, is determined so as to ensure that mass is conserved as the ice sheets and oceans exchange mass. The bedrock adjustment is computed at 500 year intervals in calculations in which the sea-level Equation (5) is inverted on a basis of spherical harmonics that is truncated at degree and order 256.
Comparisons of simulations performed with different bedrock models (Fig. 6) indicate that the impact of the visco-elastic model is largely determined by a single time-scale specific to each continent. the EA ice-shect has close correspondence between the visco-elastic model and the simple relaxation model with time constant 5 ka. The larger NA ice-sheet shows better correspondence at 3 ka,though the difference between 5 ka and 3 ka time constants is relatively much less than for the Eurasian continent. The changing relaxation time-scales as the NA ice sheet grows results in the weaker match to a single time-scale for this ice sheet as compared to the EA ice sheet. With viscoelastic bedrock coupling, we just miss the complete termination of the NA ice sheet. However, the addition at the LGM of a simple floating condition for conversion of grounded marine ice to ice shelves or icebergs rectifies this deficiency.
NA (a) and EA (b) ice-volume response to the bedrock model, full viscoelastic model vs damped-relaxation models with different time constants
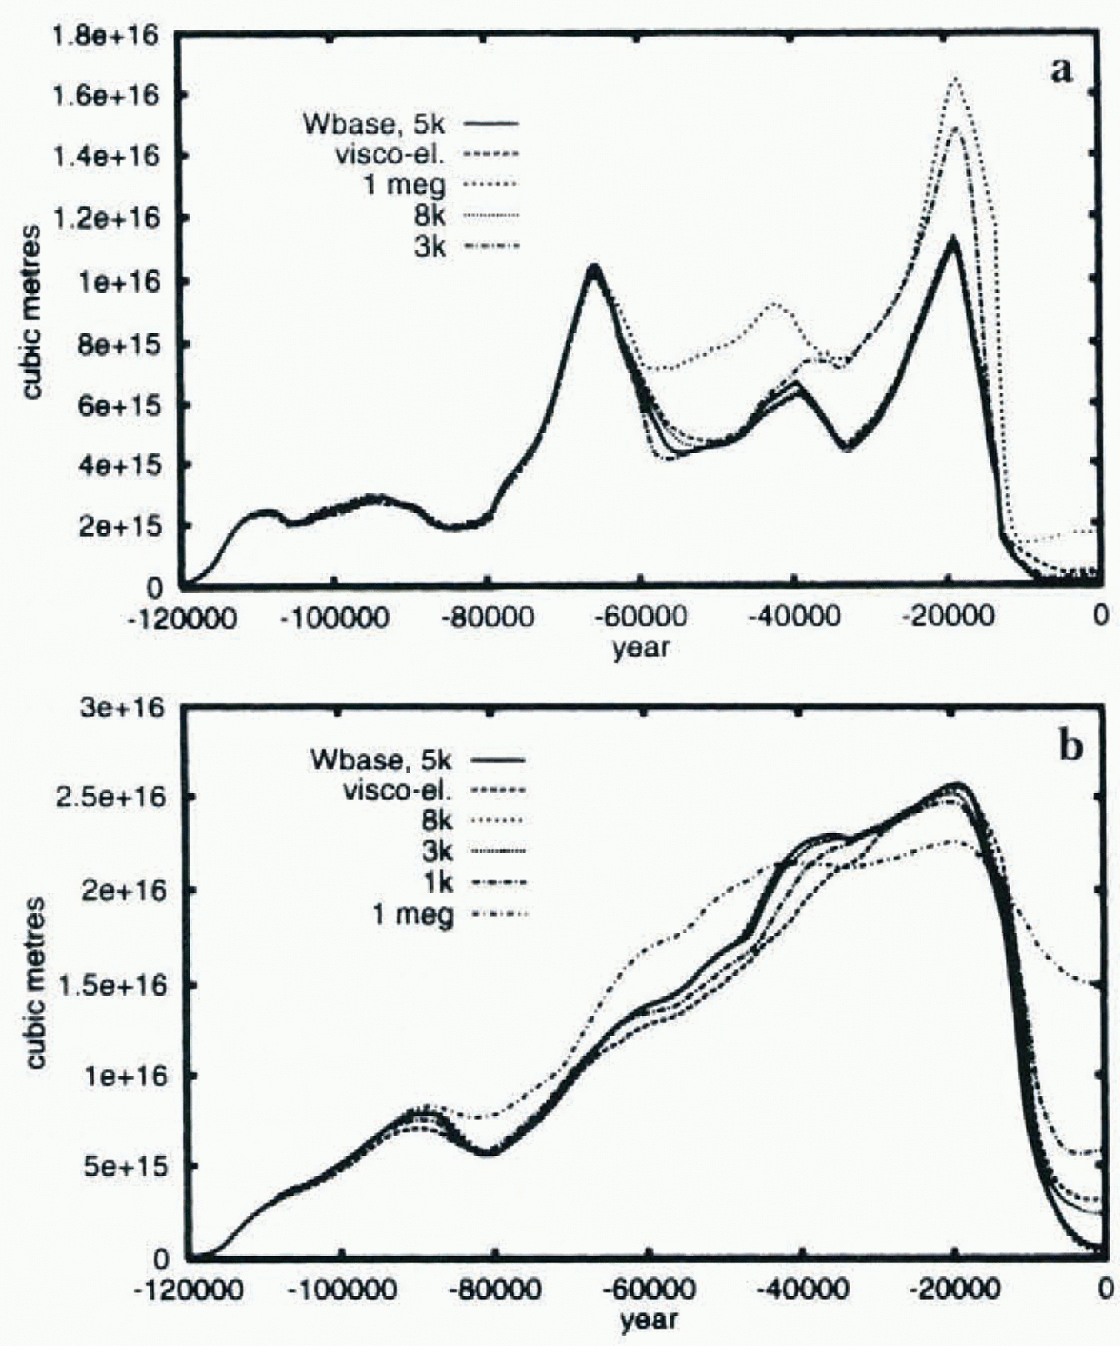
The scale dependencies of the full viscoelastic model do lead to an important caveat. Reductions in the size of the NA ice-sheet lead to different relaxation time-scales governing the response. Therefore coupled models tuned for different LGM volumes may have different bedrock relaxation time-scales, as derived from global viscoelastic models.
Eliminating bedrock response entirely (Fig. 6, time constant 1 ma) has a major impact on the deglaciation oi the NA ice sheet. The icc-sheet deglaciates far too slowly in the absence of bedrock depression, and more than 65% of the LGM volume remains when the volume stabilizes with late Holocene cooling. As well, LGM volumes are reduced. The ice-sheet grows to the same spatial extent as in the τ = 5 ka case, but the pool of ice that would fill the bedrock depression under the ice sheet is absent.
However, the climate forcing in the EA sector is strong enough to enable almost complete deglaciation to occur even without bedrock adjustment. In addition, reduced bedrock deflection due to smaller iceloads in Eurasia would correspondingly reduce the impact of changes to bedrock models of ice-sheet evolution. In contradistinction to the NA case, however, LGM ice volumes increase due to expanded southern margins over central Asia.
Summary and Conclusions
It is clear that dynamical reconstructions of the ice-age cycle require the use of sufficiently accurate climate models. We have obtained a major improvement in ice-sheet evolution (with respect to SPECMAP and the ICE-4G reconstruction) by employing the EBM climate model in a perturbative mode in which it is used to predict only changes from the modern observed climatology. Improvements in bedrock response, model resolution, ablation and rain/snow fraction determination were all required to obtain early (though still insufficient) NA glaciation, ICE-4G LGM ice volumes and full deglaciation. However, additional processes such as snow aging, dust-enhanced ablation, large-scale marine instabilities and meltwater-induced calving have been shown here not to be required to explain the main features of the most recent ice-age cycle. High mass-balance sensitivities imply that a definitive statement as to required processes may demand application of a new generation of much more highly constrained coupled models.
Our results further suggest that major climate system reorganizations are not required to explain the key features of the glacial cycle of NA ice-sheet evolution (with the possible exception of the fast glaciation at the beginning of the cycle). Inadequate treatment of marine ice components and fixed sea-ice heat capacities in the Norwegian and Greenland sea regions leave much more uncertainty with respect to the EA ice sheet. Further progress in modelling ice-age dynamics will likely require the inclusion of detailed marine ice dynamics, subglaeial processes, and/or ice thermodynamics.
The sensitivity studies presented here include two general results pertinent to the formulation of large-scale coupled ice-age models. First, in order to avoid spurious errors due to spatial discretization of ice dynamics and mass balance, our work shows that ice-sheet models require a spatial resolution of at least 0.5° in latitude and longitude. Secondly, although realistic viscoelastic bedrock models have relaxation times that are strongly dependent upon the horizontal scale of the surface load, a close correspondence in ice-sheet evolution can nevertheless be achieved using simple damped-relaxation models with time constants of 3–5 ka and 5 ka for the NA and EA ice complexes respectively.
Acknowledgements
This paper is publication number CSHD 8-14 of the Climate System History and Dynamics Collaborative Special Project that is funded by the Natural Sciences and Engineering Research Council of Canada and the Atmospheric Environment Service of Canada.



