

Early influences may accumulate over the life course to impact how well we age cognitively (Barnett et al., Reference Barnett, Hachinski and Blackwell2013; Liu et al., Reference Liu, Jones and Glymour2010). However, we know relatively little of the developmental genetic and environmental etiologies underlying variability in rates of cognitive change (Deary, Reference Deary2012; Deary et al., Reference Deary, Yang, Davies, Harris, Tenesa, Liewald and Visscher2012). The Colorado Adoption/Twin Study of Lifespan behavioral development and cognitive aging (CATSLife) covers the full range of development from infancy to midlife, leveraging both a prospective adoption and a twin design to understand the environmental (social and physical) and genetic factors that may drive increasing divergence in cognitive maintenance.
Colorado Adoption Project and the Longitudinal Twin Study
This article updates both the Colorado Adoption Project (CAP; Rhea, Bricker et al., Reference Rhea, Bricker, Corley, Defries and Wadsworth2013) and the Longitudinal Twin Study (LTS; Rhea, Gross et al., Reference Rhea, Gross, Haberstick and Corley2013) and introduces CATSLife. We first provide a brief overview of each study and then discuss the rationale for combining the two to form the first prospective study of lifespan behavioral development and cognitive aging. We hope to demonstrate that although there are several studies that assess various skills and traits throughout infancy and childhood or during midlife and late life, no studies provide a wide array of in-depth prospective assessments from infancy through middle adulthood, and hopefully, beyond.
The Colorado Adoption Project
In the 2013 special issue of Twin Research and Human Genetics, Rhea, Gross et al. (Reference Rhea, Gross, Haberstick and Corley2013) described the CAP, including its design, recruitment of parents (both adoptive and birth parents) and recruitment of older siblings and nonadoptive control families. Sample characteristics, assessment timeline for participants almost yearly from birth through age 16, covering a wide range of domains were also provided. The main attributes of CAP include the following.
1. Full adoption design, with data from adoptive and matched nonadoptive control parents and offspring, and of special significance, biological parents, facilitating tests of assortative mating, maternal effects and selective placement — shown to be absent for most measures. The inclusion of prospective data from parents and children in matched, nonadoptive control families permits even more powerful tests of genetic and environmental influences, as well as representativeness;
2. Fully prospective approach, with biological mothers being recruited prior to the birth of their children, and approximately 25% of the biological fathers assessed;
3. Early placement of adoptive children, relinquished by their biological parents within a few days of birth, and placed in adoptive homes within one month, on average;
4. Multivariate design, including standardized tests of cognitive, language and motor development; tester, teacher and parent ratings of the children’s personalities/temperaments, and miscellaneous measures (see Rhea, Gross et al., Reference Rhea, Gross, Haberstick and Corley2013 for a complete description);
5. Longitudinal design, permitting analyses of the etiologies of change and continuity in behavioral development.
At 16 years of age, participants completed, for the first time, the same tests administered to their parents over a decade and a half earlier, and again at about 21 years of age. After age 16, testing was less frequent and assessment domains, although numerous, had different foci than those of the 16-and-under CAP and operated under different funding mechanisms. In early adulthood, from ages 21–26 years, participants were tested through various follow-up grants focusing on transitions to adulthood. For the year 21 follow-up, the CAP administered a telephone interview used in the Center for Antisocial Drug Dependence (CADD), and a cognitive assessment and CAP questionnaire coincided with this CADD testing for a subset of participants. As the participant population aged, data collection from a subset of CAP participants aged 30–35 was conducted that served as a prototype of CATSLife (which will be described in detail below) beginning to assess antecedents of cognitive aging.
Contributions to Genetic and Environmental Etiologies of Complex Traits
The adoption design, with its comparison of the resemblance between related and unrelated family members, provides the most direct evidence of heritability and shared family environmental influences. This is accomplished in one of three ways: by comparing the resemblance of related siblings with that of unrelated siblings, via the sibling model, similar to the twin model and applied in many adoption studies (e.g., Beltz et al., Reference Beltz, Corley, Bricker, Wadsworth and Berenbaum2014; Bricker et al., Reference Bricker, Stallings, Corley, Wadsworth, Bryan, Timberlake and DeFries2006; Wadsworth et al., Reference Wadsworth, DeFries, Fulker and Plomin1995b); by comparing the resemblance of related parents and offspring with that of unrelated parents and offspring (Figure 1(a); e.g.,Wadsworth et al., Reference Wadsworth, Corley, Hewitt, Plomin and DeFries2002) and by combining the parent–offspring and sibling models (Figure 1(b); e.g., Wadsworth et al., Reference Wadsworth, DeFries, Fulker and Plomin1995a).
(a) Parent–offspring schematic (including birth and adoptive parents). (b) Parent–offspring-biological sibling schematic.

These models, some of which were developed by CAP researchers, have been used in the CAP to assess genetic and environmental influences on many complex traits. The CAP investigators have published over 200 peer-reviewed papers, abstracts, books and book chapters, and their work has been presented at conferences across the world, covering diverse phenotypes such as personality, religiosity and peer influence. Most notably for our purposes, CAP data have been used to assess the etiologies of stability of cognitive ability and academic achievement, both of which have been shown to be stable, with high heritabilities and stable genetic influences (e.g., Bishop et al., Reference Bishop, Cherny, Corley, Plomin, DeFries and Hewitt2003; Cardon et al., Reference Cardon, Fulker, DeFries and Plomin1992; Cherny et al., Reference Cherny, Corley, Fulker, Plomin and DeFries1996; Plomin, Reference Plomin2012; Wadsworth et al., Reference Wadsworth, Corley, Hewitt and DeFries2001, Reference Wadsworth, Corley, Hewitt, Plomin and DeFries2002, Reference Wadsworth, DeFries, Fulker and Plomin1995a, Reference Wadsworth, DeFries, Fulker and Plomin1995b). More recent adoptions are often international, with longer wait times for placement than adoptions within country. Furthermore, many within-country adoptions are now ‘open’, increasing the likelihood of selective placement. Thus, with its early and minimal selective placement, the CAP may be the last of its kind. Consequently, extending our coverage of participants into midlife and beyond may be especially important for studying later behavioral development and cognitive functioning as we age.
The Longitudinal Twin Study
The 2013 special issue also featured an update of the Colorado Twin Registry (CTR; Rhea, Gross et al., Reference Rhea, Gross, Haberstick and Corley2013), describing registry enrollment, sample characteristics, and several studies which contribute to and utilize the data from the CTR, including the LTS, which has served as a comparison sample to clinical samples in studies such as the CADD, and as the primary sample to studies such as the Executive Cognitive Function-LTS (ECF-LTS). The recent CTR follow-up in this special issue (Corley et al., Reference Corley, Wadsworth, Reynolds, Rhea and Hewittin press) takes a more general look at the multiple samples of CTR twins and other research involving LTS. The LTS has largely followed the same testing schedule as that of the CAP and has the following main attributes: (1) prospective, longitudinal structure assessing traits from infancy into early adulthood; (2) multivariate format (with measures nearly parallel to those of the CAP) and (3) 483 twin pairs and their parents.
Contributions to Genetic and Environmental Etiologies of Complex Traits
Just as adoption studies provide direct estimates of shared environmental influence and estimates of genetic influence, twin studies also provide estimates of both genetic and environmental influences. In fact, some of the same structural equation models, or the relationships they represent, used to estimate these parameters from adoption data may also be used to estimate them from twin data, by simply changing the path coefficient indicating the sibling or twin correlation (e.g., Figure 1a and b).
CATSLife
In addition to our brief update of the CAP and LTS, we now describe the merging of these two pivotal studies to found the Colorado Adoption/Twin Study of Lifespan Behavioral Development and Cognitive Aging (CATSLife). CATSLife is the first prospective study of lifespan behavioral development and cognitive aging, utilizing detailed early life assessments and powerful design features, employing the strengths of both twin and adoption methodologies and indeed, combining the two (e.g., Bishop et al., Reference Bishop, Cherny, Corley, Plomin, DeFries and Hewitt2003). The inter-relatedness of the many projects involved with the CAP and the LTS illustrates the synergy that exists in the merging of these two projects. In the CATSLife, we seek to exploit this synergy in the study of genetic and environmental influences on behavioral development and cognitive aging.
As we age, concerns about cognitive decline become more common. Concern over loss of mental capacity often well exceeds or at least equals concerns over loss of physical ability (Anderson et al., Reference Anderson, Day, Beard, Reed and Wu2009; Centers for Disease Control, 2011; Sterrett et al., Reference Sterrett, Titus, Benz and Kantor2017). Over 70% of adults aged 30 and older report worries about memory loss in late life (e.g., Sterrett et al., Reference Sterrett, Titus, Benz and Kantor2017). As concerning as this is, little is known about the developmental genetic and environmental influences underlying cognitive maintenance and decline.
Cognitive development during infancy, early childhood and adolescence, together with health and activity patterns, may establish cognitive reserves important to later cognitive functioning (Barulli & Stern, Reference Barulli and Stern2013; Beck et al., Reference Beck, Franz, Xian, Vuoksimaa, Tu, Reynolds and Kremen2018; Kremen et al., Reference Kremen, Beck, Elman, Gustavson, Reynolds, Tu and Franz2019). Thus, a more thorough understanding of the environmental (both social and physical) and genetic factors that result in differences in cognitive maintenance is necessary to the establishment of relevant intervention points. A prospective study of genetic and environmental influences on behavioral development and cognitive performance and change from a lifespan perspective, such as CATSLife, addresses the need to assess individual differences in cognitive performance and change from infancy through adulthood. Cognitive abilities are important to health and wellbeing across development (Deary, Reference Deary2012; Plomin & Deary, Reference Plomin and Deary2015; Salthouse, Reference Salthouse2012), but the extent and manner in which cognitive abilities in early life promote later life cognitive functioning is not clear. Thus, assessment of cognitive trajectories, and their moderators — spanning childhood through early adulthood with reasonable assessment intervals — are needed to understand potential pathways and precursors of resilience and vulnerability on the cusp of middle adulthood (see Figure 2).
Early origins versus proximal influences. If early life origins of cognitive health exist, do cognitive growth patterns in infancy/early childhood (and adolescence) uniquely impact adult functioning beyond proximal age-to-age impacts and innovations?
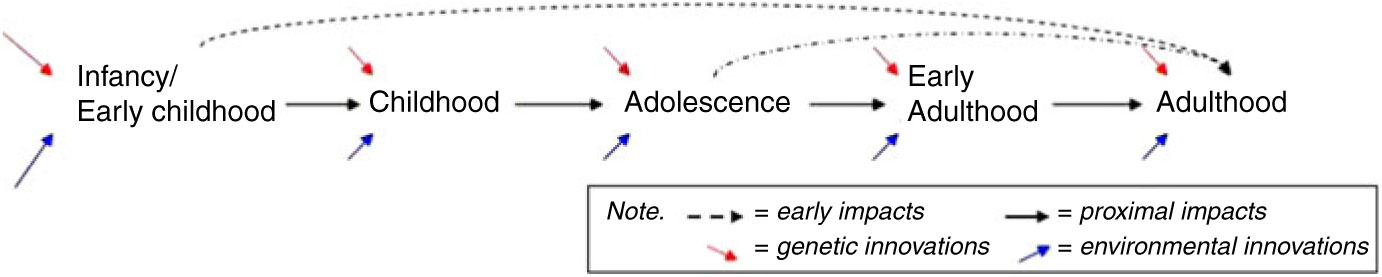
Although a number of genetically informative studies have investigated adulthood and the transition to adulthood, relatively few have assessed a broad range of indices of normal behavioral development (Kremen et al., Reference Kremen, Franz and Lyons2012; Radler & Ryff, Reference Radler and Ryff2010), nor have the ability to draw on a wide array of prospectively assessed childhood tasks to examine precursors of cognitive function and physical health relationships, or moderating influences. Therefore, examining the relations among cognitive abilities and health in a longitudinal, genetically and environmentally informative study is essential. Figure 2 conveys a basic schematic of age-to-age proximal impacts versus unique influences of early childhood and adolescence to adult functioning on the cusp of midlife that underlie hypotheses being tested in the CATSLife. The purpose of the CATSLife, therefore, is to conduct a genetically sensitive study of individual differences in behavioral and cognitive changes on the cusp of middle adulthood. The target sample includes up to 1600 participants between the ages of 30 and 40 years who have been studied almost yearly from birth to early adulthood. This makes CATSLife the first prospective study of behavioral development and cognitive aging in a genetically and environmentally informative sample, exploiting detailed measures obtained over the past 35 years to study genetic and environmental influences on both short- and long-term inter- and intra-individual change.
Goals/Aims of the CATSLife
The CATSLife has five aims nested within two overarching goals to evaluate individual differences in rates of growth and maintenance of abilities and to evaluate specific genetic, biomarker, behavioral health and environmental pathways that can change cognitive functioning:
(1) Conduct a genetically sensitive study of behavioral and cognitive changes from infancy into middle adulthood: (a) Map individual differences in growth and maintenance of cognitive abilities; (b) Evaluate within-person variability in cognitive performance on the cusp of midlife.
(2) Track factors that decrease, sustain or boost cognitive performance: (a) Physical factors and health behaviors; (b) Biochemical and genetic pathways; (c) Environmental attributes, via self-report and geospatial measures.
Progress to Date: Data Collection
Participants
We began testing in August 2015, and our current total as of April 1, 2019 is 1155 tested participants. Table 1 shows our target and our current tested participants. Data collection is ongoing at the writing of this article. After 36 months of testing, the age at testing for LTS (N = 553) was on average 29.2 years (SD = 1.1, interquartile range = 1.7, range = 5.2), and for CAP (N = 435), the age at testing was on average 37.8 years (SD = 3.1, interquartile range = 3.7, range = 18.0). About 95% of participants’ addresses have been geocoded in the first 3 years of data collection, with 61.7% residing in the state of Colorado, 37.0% residing in the USA outside Colorado and 1.0% residing outside the USA.
Planned and tested participants

Measures
The general testing protocol consists of online questionnaires and an in-person assessment. Our selection of measures was guided by three considerations. First, we chose measures relevant to early and middle adulthood. Second, to facilitate intergenerational and longitudinal analyses, selected measures were as consistent as possible with those of earlier ages, including CAP and LTS parent measures (see Table 2). Third, some measures were chosen to be compatible with other studies of adulthood. Primary measures of cognitive function, physical health and function, and potential moderators and mediators are highlighted.
CATSLife assessments and primary measures

a (Wechsler, Reference Wechsler1993).
b (Dohrenwend et al., Reference Dohrenwend, Krasnoff, Askenasy and Dohrenwend1978; Turner et al., Reference Turner, Wheaton and Lloyd1995).
c (Friedman et al., Reference Friedman, Miyake, Altamirano, Corley, Young, Rhea and Hewitt2016, Reference Friedman, Miyake, Young, Defries, Corley and Hewitt2008).
d (Prawitz et al., Reference Prawitz, Garman, Sorhaindo, O’Neill, Kim and Drentea2006).
e (Thompson et al., Reference Thompson, McNeel, Dowling, Midthune, Morrissette and Zeruto2009).
f (Buysse et al., Reference Buysse, Reynolds, Monk, Berman and Kupfer1989).
g (EASI = Emotionality, Activity, Sociability, and Impulsivity Inventory: Buss & Plomin, Reference Buss and Plomin2014; SWLS = Satisfaction with Life Scale: Diener et al., Reference Diener, Emmons, Larsen and Griffin1985; BFI = Big Five Inventory: John & Srivastava, Reference John and Srivastava1999; RPWB = Ryff’s Scales of Psychological Well-Being: Ryff & Keyes, Reference Ryff and Keyes1995; Springer & Hauser, Reference Springer and Hauser2006).
h (Sliwinski et al., Reference Sliwinski, Mogle, Hyun, Munoz, Smyth and Lipton2018).
i (MASQ = Mood and Anxiety Symptoms Questionnaire: Clark & Watson, Reference Clark and Watson1991; ASRS = Adult ADHD Self-Report Scale Symptom Checklist: Kessler et al., Reference Kessler, Adler, Ames, Demler, Faraone, Hiripi and Walters2005; PSWQ = Penn State Worry Questionnaire: Meyer et al., Reference Meyer, Miller, Metzger and Borkovec1990; BIS = Barratt Impulsiveness Scale: Patton et al., Reference Patton, Stanford and Barratt1995; RRS = Ruminative Response Scale: Treynor et al., Reference Treynor, Gonzalez and Nolen-Hoeksema2003; Nolenhoeksema & Morrow, Reference Nolenhoeksema and Morrow1991).
j (c.f., Hassenstab et al., Reference Hassenstab, Aschenbrenner, Balota, McDade, Lim, Fagan and Bateman2018).
k (DAS = Dyadic Adjustment Scale: Spanier, Reference Spanier1976).
l (DIS = National Institute of Mental Health (NIMH) Diagnostic Interview Schedule: Robins et al., Reference Robins, Cottler, Bucholz, Compton, North and Rourke1999).
m (Interview items included from the PhenX Toolkit’s “Alcohol, Tobacco, and Other Substances” domain (adult protocols): Hamilton et al., Reference Hamilton, Strader, Pratt, Maiese, Hendershot, Kwok and Haines2011).
n (Cohen & Hoberman, Reference Cohen and Hoberman1983).
o (Friedman et al., Reference Friedman, Miyake, Young, Defries, Corley and Hewitt2008; Waters et al., Reference Waters, Marhe and Franken2012).
Online survey
The survey takes approximately 1 hour to complete and encompasses measures of demographics, environments, health and wellbeing, and relationships. Information concerning the health and medical history is asked using a health history questionnaire that includes ratings of general health as well as self-report history of injuries, diseases and disabilities. We assess self-reported exercise habits, substance use and nutrition. Questions concerning activity engagement (tapping physical, social and cognitive activities) are included, with participants reporting frequency (hours per week) and type of activities engaged in via open-ended queries (e.g., clubs, hobbies, musical instruments, and activities with pets). Sleep quality is measured using the Pittsburgh Sleep Quality Index (Buysse et al., Reference Buysse, Reynolds, Monk, Berman and Kupfer1989).
Additional mediators and moderators of cognitive change, for example, may include social contexts and wellbeing. We measure adult child–parent relationships, sibling relationships, parenting, peer and romantic relationships. Of particular interest to CATSLife are indices of participants’ social networks and support, relationship quality/satisfaction and frequency of contact. We continue to measure temperament and personality domains. We also include a number of questionnaires tapping anxiety/depressive symptoms, attention, worry and rumination.
In-person assessments
The in-person assessments take approximately 5.5 hours to complete. Due to the length of in-person assessments, appointments are set for early morning to facilitate sample collection.
General and specific cognitive abilities
We focus on general cognitive ability and specific cognitive ability domains: Verbal, Spatial, Perceptual Speed and Memory. The specific cognitive abilities battery is based on the Hawaii Family Study of Cognition battery (DeFries et al., Reference DeFries, Plomin, Vandenberg and Kuse1981) and includes nine tests (i.e., Vocabulary (Educational Testing Service; ETS), Things Categories Test (ETS), Card Rotations (ETS), Paper Form Board, Colorado Perceptual Speed Test (DeFries et al., Reference DeFries, Plomin, Vandenberg and Kuse1981), Subtraction and Multiplication Test (ETS), Picture Memory, Names and Faces, Pedigrees). We also assess abilities using the Wechsler Adult Intelligence Scale — 3rd Edition (WAIS-III) (Wechsler, Reference Wechsler1993). General cognitive ability is assessed in two ways: as the first unrotated principal component score from the specific cognitive ability measures and using Full-Scale IQ from the WAIS-III.
Executive function
The executive function battery includes Working Memory/Updating, Response Inhibiting and Shifting measures (Friedman et al., Reference Friedman, Miyake, Altamirano, Corley, Young, Rhea and Hewitt2016, Reference Friedman, Miyake, Young, Defries, Corley and Hewitt2008) with two tasks each to measure Inhibiting (Antisaccade and Stroop tasks), Updating (Keep Track and Letter Memory tasks) and Shifting (Letter/Number and Category Switch). In addition, we included the self-report Adult ADHD Self-Report Scale Symptom Checklist (ASRS-v1.1; Kessler et al., Reference Kessler, Adler, Ames, Demler, Faraone, Hiripi and Walters2005).
Magnetic resonance imaging
LTS twins have had magnetic resonance imaging (MRI) scans conducted at age 28 via separate funding (ECF-LTS); structural and functional indices are available to the CATSLife. Hence, we will likewise evaluate MRI functional and structural outcomes, particularly hippocampal and frontal cortex regions, in testing hypotheses of cognitive growth patterns and variability in cognitive performance.
Health and functioning
We follow the standard protocols (e.g., PhenX Toolkit, Hamilton et al., Reference Hamilton, Strader, Pratt, Maiese, Hendershot, Kwok and Haines2011) as appropriate. Fasting blood samples are drawn by trained phlebotomists or at a professional clinic (e.g., Clinical Translational Research Center, CTRC). We are collecting serum, Ethylenediaminetetraacetic acid (EDTA)-plasma and Buffy coat samples, from all respondents who consent to a blood draw (98% to date), as well as peripheral blood mononuclear cells from sodium citrate-plasma in a subsample. All blood fractions are stored at −80°C immediately after preparation. Height, weight, waist and hip circumference are measured. Body mass index (BMI) is calculated from weight and height. In addition, resting blood pressure (systolic, diastolic and mean arterial blood pressure) and resting heart rate are taken once after subject has been sitting quietly for 5 min, then twice more at 1-min intervals thereafter. Two assessments of lung functioning using a spirometer are performed measuring forced vital capacity and forced expiratory volume in 1 s. Hand grip strength is measured using a dynamometer with three trials on each hand at 20-s intervals with dominant handedness recorded.
Biomarkers and genotyping
DNA extraction from blood and saliva samples is performed. Serum lipid and brain-derived neurotrophic factor (bdnf) biomarker assays are performed using established protocols. Direct genotyping (Taqman methodology) is performed for two single nucleotide polymorphisms (SNPs) in APOE, rs7412 and rs429358, using existing buccal cell-derived DNA from earlier assessments of LTS and CAP, or using DNA extracted from the current CATSLife. We are conducting genome-wide genotyping using the Affymetrix Axiom™ Precision Medicine Research array.
Earlier CAP/LTS assessments
CATSLife benefits from the wealth of information that has been collected at earlier measurement occasions of CAP and LTS, and from separately funded collaborative studies. Table 3 highlights the overlapping coverage of domains and measures across the CAP and LTS at assessments prior to CATSLife with exemplar traits and variables. In addition, we are able to evaluate changes in the familial environment. Parent sociodemographic data (education, occupational prestige) at entry into the project, and at assessment years 7, 16 and 21 are also available (Rhea, Bricker et al., Reference Rhea, Bricker, Corley, Defries and Wadsworth2013; Rhea, Gross et al., Reference Rhea, Gross, Haberstick and Corley2013).
Longitudinal CAP and LTS assessments and primary measures prior to CATSLife

P = Parent; R = Teacher; * = Adult report of child (parent or teacher) and Child self-report; C = CAP; T = LTS; ‡ = ECF-LTS data collected at age 28 years (overlaps CATSLife assessment time frame).
a (Caldwell & Bradley, Reference Caldwell and Bradley1978).
b (Brooks-Gunn & Petersen, Reference Brooks-Gunn and Petersen1984; Dohrenwend et al., Reference Dohrenwend, Krasnoff, Askenasy and Dohrenwend1978).
c (Jessor & Jessor, Reference Jessor and Jessor1977).
d (Rowe & Plomin, Reference Rowe and Plomin1977).
e (Buss & Plomin, Reference Buss and Plomin1975).
f (Harter, Reference Harter1982).
g (Moos & Moos, Reference Moos and Moos1981).
Smartphone study of daily cognitive functioning
Assessments of cognition outside the laboratory setting may confer greater ecological validity as performance may be more sensitive to contextual factors (Sliwinski et al., Reference Sliwinski, Mogle, Hyun, Munoz, Smyth and Lipton2018). With support from an administrative supplement from the National Institute on Aging (NIA), we will be able to evaluate inconsistency and plasticity in daily cognitive performance against an in-depth lab assessment of cognitive abilities. A subset of CATSLife participants is completing ambulatory daily cognitive assessments, adapting protocols from the ESCAPE study (Sliwinski et al., Reference Sliwinski, Mogle, Hyun, Munoz, Smyth and Lipton2018). In the 2-year supplement, we aim to enroll up to 600 CATSLife participants and are at 30% of target as of April 2019. The tasks are administered on Droid X smartphones with three assessments of cognition per day across a 14-day period (approximately 3 min to complete each session). After completion, we provide participants with a summary of their own cognitive performance across the 2 weeks that we hope maintains interest in CATSLife. The protocol includes a morning survey and a momentary survey before and after the completion of cognitive tasks. The surveys tap sleep quality and anticipatory stress (morning survey), as well as participant locale, activities and distractibility (momentary survey). Two cognitive tasks were adapted from the ESCAPE study: Symbol Search (perceptual speed) and Dot Memory (working memory; Sliwinski et al., Reference Sliwinski, Mogle, Hyun, Munoz, Smyth and Lipton2018). In addition, two cognitive tasks were adapted from validated measures: the Stroop task (executive functioning; Friedman et al., Reference Friedman, Miyake, Young, Defries, Corley and Hewitt2008; Waters et al., Reference Waters, Marhe and Franken2012) and the Shopping task (paired associate memory; c.f. Hassenstab et al., Reference Hassenstab, Aschenbrenner, Balota, McDade, Lim, Fagan and Bateman2018). ESCAPE participants overlap in age with the CATSLife sample, and this affords us the opportunity to evaluate the roles of contextual and stress factors on inconsistency and plasticity and to compare CATSLife to the more diverse ESCAPE sample. Thus, we will evaluate whether increased vulnerability to stress and other contextual effects on inconsistency and plasticity will be evident for those with lower social reserve capacity (Gallo et al., Reference Gallo, Bogart, Vranceanu and Matthews2005; Gallo & Matthews, Reference Gallo and Matthews2003), that is, those with lower socioeconomic status (SES), non-White and limited social support networks. Moreover, we will assess etiological contributions to inconsistency and plasticity components of short-term variability, including genetic risk (e.g., APOE). Figure 3 shows the overarching conceptual model.
Smartphone study: conceptual model. Anticipatory influences rated in the morning on cognitive performance (plasticity, inconsistency) mediated by momentary contextual factors, with moderation of mediation by social resources.

Illustrative work to date
Modeling individual differences
Childhood and mid-adulthood may be particularly salient periods predictive of late-life cognitive health (Deary, Reference Deary2012; Lachman, Reference Lachman2004). Hence, variability in early childhood and adolescent cognitive growth rates may be uniquely salient to later functioning. A developmental model, such as the genetic simplex factor model shown in Figure 4, facilitates the estimation of the magnitude of genetic and environmental influences at each age, as well as age-to-age genetic and environmental transmission, age-specific innovations, and genetic and environmental influences common to all ages may be assessed. We have previously leveraged a genetic simplex factor model and illustrated the strengths of combining data from LTS twins and CAP adoptive and nonadoptive siblings from ages 1 to 12 (Bishop et al, Reference Bishop, Cherny, Corley, Plomin, DeFries and Hewitt2003). Genetic influences contributed to both continuity and change, shared environment contributed almost entirely to continuity but waned over age, and nonshared environment contributed almost entirely to change. However, in middle childhood, nonshared environmental influences contributed to continuity as well as to change, and during the transition to early adolescence, genetic influences contributed only to continuity.
Genetic/environmental simplex schematic (c.f. Bishop et al, Reference Bishop, Cherny, Corley, Plomin, DeFries and Hewitt2003).

Longitudinal data also afford opportunities to fit characteristic growth curve models where change over age is a phenotype of interest. Recently, we have fitted such models in CAP (c.f. Figure 5) to evaluate memory and perceptual speed traits that may be susceptible to the effects of stress (Ricker et al., Reference Ricker, Corley, DeFries, Wadsworth and Reynolds2018). Our results suggest that emergent variability in memory and speed trajectories between 9 and 36 years are not explained by cumulative perceived stress indices in childhood and adolescence. However, adopted individuals showed smaller gains in speed than nonadopted individuals, consistent with work on international adoptees showing smaller prefrontal cortex volumes by adolescence than nonadopted counterparts (Hodel et al., Reference Hodel, Hunt, Cowell, Van Den Heuvel, Gunnar and Thomas2015). What adoption status marks in terms of stress-related exposure is not clear. However, vulnerability to differential speed trajectories may have implications for lifespan cognitive functioning; thus, further investigation is warranted.
Phenotypic structured growth model: Gompertz (c.f., Ricker et al, Reference Ricker, Corley, DeFries, Wadsworth and Reynolds2018). Note. I = baseline performance (lower asymptote) in Y; A = change from lower to upper asymptote; R = rate of approach to the asymptote; D = age at accelerated change.

Genetic factors
We have analyzed APOE genotypes to evaluate associations with longitudinal childhood IQ in 1381 individuals from CAP and LTS between ages 7 and 16 (Reynolds et al., Reference Reynolds, Smolen, Corley, Munoz, Friedman, Rhee and Wadsworth2019). Our findings, the first to address APOE in three waves of longitudinal cognitive ability data, suggest that APOE e4 genotypes may be associated with lower ability in childhood, and that females may be particularly vulnerable. We observed results for Full Scale and Performance IQ with significant but weaker effects for Verbal IQ. Moreover, we could observe effects as early as age 7 alone in the full sample. Such a series of results suggests that early life is a key period with which genetic factors associated with aging outcomes may contribute to cognitive reserves (Barulli & Stern, Reference Barulli and Stern2013) and hence experiences that boost reserves may be imperative. We are following up with a replication using imputed APOE SNPs in the Twins Early Development Study (TEDS) sample (Haworth et al., Reference Haworth, Davis and Plomin2013) at the same ages (7, 12 and 16) and another Coloradan sample of twins (Colorado Learning Disabilities Research Center [CLDRC]; Willcutt et al., Reference Willcutt, McGrath, Pennington, Keenan, DeFries, Olson and Wadsworth2019) that has a similar IQ battery to CAP/LTS.
With the SNPs from the Affymetrix Axiom™ Precision Medicine Research Array, we will compute polygenic risk scores (PRS) from the latest genome wide association study (GWAS) for traits such as Alzheimer’s disease, educational attainment, childhood IQ, BMI and other traits related to healthy aging. Indeed, the TEDS team, as part of the CATSLife effort, has been developing techniques using PRS that we will adapt to CATSLife samples when the genotyping data are ready for analysis. For example, we highlight methods to evaluate polygenic score differences between DZ twins in relationship to differences in their core developmental outcomes (cognitive, health, psychopathology and personality) to reveal the extent to which genetic differences relate causally to within-family differences in outcomes (Selzam et al., Reference Selzam, Ritchie, Pingault, Reynolds, O’Reilly and Plomin2019). Thus, we anticipate additional replication work with TEDS, as well as CLDRC samples, among others.
Environmental factors
We are conducting analyses of environmental features and environmental stress that may impact health behaviors and cognitive change. As highlighted above, our questionnaire and in-person batteries include a number of measures tapping contexts and environments that may be associated with cognitive functioning, including neighborhood stress and activity engagement (e.g., Munoz, Corley et al., Reference Munoz, Corley, Wadsworth and Reynolds2017; Munoz et al., Reference Munoz, Scott, Corley, Wadsworth, Sliwinski and Reynolds2018; Trubenstein et al., Reference Trubenstein, Corley, Wadsworth and Reynolds2018, Reference Trubenstein, Haberstick, Corley, Wadsworth and Reynolds2017). In addition to self-report, we are capturing geospatial measurements of local residential environments including sociodemographic neighborhood features, rurality and walkable access to parks and trails (e.g., Munoz, Corley et al., Reference Munoz, Corley, Wadsworth and Reynolds2017; Munoz et al., Reference Munoz, Scott, Corley, Wadsworth, Sliwinski and Reynolds2018; Reynolds et al., Reference Reynolds, Trubenstein, Munoz, Corley and Wadsworth2017). In addition, we have amassed census tract-level data from 1970 to 2010 for all Census sociodemographics using fixed tract boundaries to allow us to map each participant’s location across time (c.f. Logan et al., Reference Logan, Stults and Xu2016). Our work to date suggests appreciable variability in socioenvironmental measures of importance to the project. We highlight some of these below.
Area Deprivation Index
The Area Deprivation Index (ADI) is a measure of socioeconomic deprivation experienced by a neighborhood based on multiple Census indices, where higher values represent higher deprivation (Singh, Reference Singh2003). We are evaluating measures of disadvantage, such as ADI and self-reported neighborhood problems, and their associations with cognitive functioning (e.g., Munoz et al., Reference Munoz, Scott, Corley, Wadsworth, Sliwinski and Reynolds2018; Munoz, Wadsworth et al., Reference Munoz, Wadsworth, Corley and Reynolds2017). We have obtained 2013 ADI scores for CATSLife participants during our first 3 years of data collection (University of Wisconsin School of Medicine and Public Health, 2019). Figure 6(a) shows the range of ADI national rankings (in percentiles) for the neighborhoods of our CATSLife sample, and Figure 6(b) shows a scatterplot of the ADI rankings for participants’ respective states (in deciles) and the USA (in percentiles) measured on the census block group level. The CATSLife neighborhoods (census blocks) skew toward lower deprivation rankings; however, we do have appreciable variation and range spanning the continuum (see Figure 6(a)). The ADI U.S. national and state rankings are strongly associated, but with relatively greater variation in the national than the state rankings (Figure 6(b)).
Range of ADI in the CATSLife sample from the first 3 years of data collection (N = 945): (a) National (US) Rankings and (b) State by National (US) Rankings.

Rurality–Urbanicity
Analyses of rurality, activity engagement and cognitive functioning at the CATSLife waves are underway. With measures of current address, for each participant, we have created the Index of Relative Rurality (IRR; Inagami et al., Reference Inagami, Gao, Karimi, Shendge, Probst and Stone2016; Waldorf, Reference Waldorf2006) at the level of county and census tract based on indices of population, population density, percentage urban and distance to nearest metro/micropolitan statistical areas. Figure 7 conveys the range of IRR values at the county level, with possible values between 0 (completely urban) and 1 (completely rural), showing appreciable variability in our sample (IRR County range = 0.05, 0.75).
IRR in the CATSLife sample from the first 3 years of data collection (N = 947).

Park and trail accessibility
We are evaluating direct and mediated pathways by which objective and perceived reports of activity spaces are linked to physical and cognitive functioning (e.g., Reynolds et al., Reference Reynolds, Trubenstein, Munoz, Corley and Wadsworth2017). For example, we have calculated park and trail accessibility from maps sourced from Open-Street Maps (www.openstreetmap.org) and geocoded distance and density measures in order to compare these to self-reported access to parks, trails, recreation centers (c.f. Sallis et al., Reference Sallis, Bowles, Bauman, Ainsworth, Bull, Craig and Bergman2009), and ultimately to health biomarker variables (e.g., BMI, physical activity, blood pressure and lipids) and cognitive performance. We display an exemplar density map showing the variation in the relative density of parks for CATSLife participants in the continental USA (see Figure 8). Thus, while the majority of our CATSLife participants to date live in Colorado, with marked density of parks within one mile typically along the Front Range, participants scattered throughout the USA show variation in local park availability.
Geospatial mapping in the CATSLife sample from the first 3 years of data collection (N = 940): density of parks within a 1-mile radius.

Discussion
The current article provides updates to both the LTS and the CAP and introduces the Colorado Adoption/Twin Study of Lifespan behavioral development and cognitive aging (CATSLife), representing the merging of these two unique studies. CATSLife leverages long-term, in-depth longitudinal data from these foundational parent studies with a new and currently ongoing data collection on the verge of midlife to evaluate early and concurrent etiological factors that may be important to later life cognitive functioning and wellbeing.
The measurement of multiple environmental, biomarker and genetic factors to evaluate pathways of functioning at midlife is described for CATSLife. The environmental measures include a number of self-reported instruments as well as proximal and distal geospatial measurements of environments such as sociodemographic neighborhood features, rurality and accessibility to parks and trails. Furthermore, we are assessing cognitive inconsistency and plasticity in a subset of CATSLife participants via ambulatory daily cognitive assessments across 14 days that we will be able to evaluate against an in-depth lab assessment of cognitive abilities. In addition to measures of the environment, biological assessments include biomarkers, as well as targeted and genome-wide genotyping. Our findings, the first to address APOE in three waves of longitudinal cognitive ability data, suggest that APOE e4 genotypes may be associated with lower ability in childhood and that females may be particularly vulnerable.
In addition to the wide array of measures, CATSLife benefits from both adoption and twin study design features to evaluate environmental and genetic etiologies. We have the rare opportunity to characterize prospectively the nature of cognitive development and change with follow-up testing of adoptive and nonadoptive siblings, and twins as they move toward midlife, and previously assessed on a wide array of measures almost yearly from birth into their twenties. Hence, we are in a unique position to address genetic and environmental etiologies through the study of the sibling and twin relationships as well as parent–offspring, and combined parent–offspring–sibling. Direct estimates of environmental influence provided by the adoptive sibling design coupled with direct measurements of the environment will facilitate tests of gene–environment interplay. The collection of biomarker and genome-wide genotype data facilitates additional analyses of pathways to sustaining cognitive functioning.
In terms of recruitment efforts, we are currently at a response rate of 72% of our target sample 3.5 years into testing, and still ongoing at this time. The supplementary smartphone project launched in the last year is at 30% of the target sample with increasing uptake rates. The wealth of longitudinal data will allow us to address potential sample biases of those recruited by the close of this assessment wave versus those who did not participate.
Combining the two foundational CAP and LTS studies into CATSLife affords the opportunity to elucidate genetic and environmental mechanisms contributing to the growth and maintenance of cognitive abilities and timing of these mechanisms. Moreover, this first prospective study of lifespan behavioral development and cognitive aging will also provide a better understanding of how genetic and environmental influences interact with early life factors to affect other adult outcomes including physical functioning and general wellbeing. An improved understanding of genetic and environmental influences and how they interact with early life factors to affect adult outcomes may contribute to improved cognitive and physical functioning and wellbeing.
Acknowledgments
The authors wish to thank Kyle Gebelin for his assistance with Figure 8. We are especially grateful to our staff for their tireless efforts, and the continued support, patience and generosity of time of the many families participating in either the CAP or LTS over the years, and now in the CATSLife. Without their dedication, none of these projects would have been possible.
Financial support
The CATSLife is supported by a grant and administrative supplement from the NIA (AG046938 and AG046938-03S1; Reynolds & Wadsworth, MPIs). During data analysis and the preparation of the manuscript, Elizabeth Munoz was partly supported by NIA F32AG056134. The CAP and the LTS have been funded across the years by numerous sources, including a CRCW grant from the University of Colorado; National Institutes of Health grants HD010333, HD18426, MH43899, HD036773, DA05131, DA011015, DA046064 and DA042755; the Spencer and William T. Grant Foundations; and the John D. and Catherine T. MacArthur Foundation. The ECF-LTS is currently supported by MH063207. The content of this manuscript is solely the responsibility of the authors and does not necessarily represent the official views of the National Institutes of Health.
Conflicts of interest
None.
Ethical standards
The authors assert that all procedures contributing to this work comply with the ethical standards of the relevant national and institutional committees on human experimentation and with the Helsinki Declaration of 1975, as revised in 2008.
Appendix. The CATSLife research team at four sites

Note. UC = University of California; CU = University of Colorado.


