


6 Institutional development in new democracies
Network structure and uncertainty shape the incentives of political and economic elites to act collectively in the process of creating new institutions. The two previous chapters each explored the impact of uncertainty. Chapter 4 showed how political uncertainty structures ties between parties and firms. Chapter 5 demonstrated how political uncertainty interacts with network breadth to structure human ties, in the form of career networks, between the state and the economy.
In order to understand the link between networked societies and institutional development, this chapter identifies different forms of state–society relations that have emerged among eleven countries in post-socialist Europe through data that capture the two features identified as critical variables in this study: the breadth of social networks and the level of uncertainty in the political and economic field.
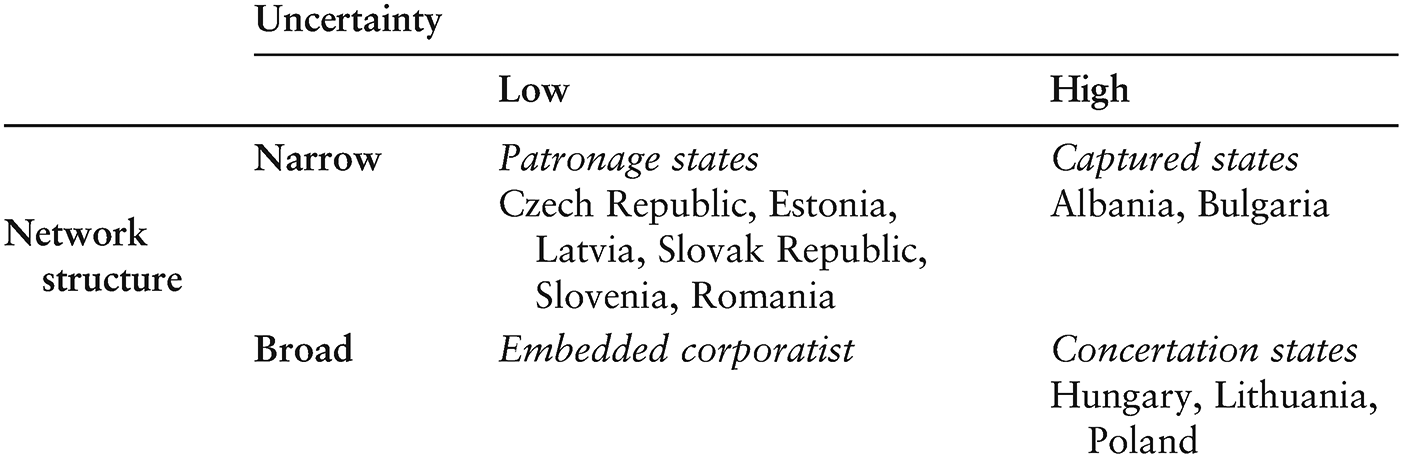
In describing the trajectories toward institutional development taken by the countries in question, I identify the following four types. First, there are the post-communist countries that have developed broad networks among firms and between the economic and political elite and have relatively high levels of uncertainty. These concertation states have made the most progress in the development of broadly distributive institutions. Second, countries with narrow networks and low levels of uncertainty have developed patronage states. These states have made moderate progress on the development of broad institutions. Third, countries with narrow networks and high levels of uncertainty have developed captured states. These countries have made the least progress in the development of broadly distributive institutions. Finally, the fourth category consists of embedded corporatist states, which comprise broad networks and low uncertainty. I do not expect to find countries with competitive elections that fit in this category. Rather, the combination of low uncertainty and broad networks describes Asian developmental states (for example, South Korea, as described by Evans Reference Evans1995).
This chapter confirms the finding that in countries in which dramatic reform and institutional development are taking place simultaneously – as in many emerging market countries and all the post-socialist nations – one tends to observe the emergence of broadly distributive institutions when uncertainty is higher and social networks are broader. This is counterintuitive, and in striking contrast to arguments in economics and political science that strong social networks hamper institutional autonomy, which is instead reinforced by predictable, fast, and early reform (Lipton and Sachs Reference Lipton and Sachs1990a; Lipton and Sachs Reference Lipton and Sachs1990b; Sachs Reference Sachs1994; Shleifer and Vishny Reference Shleifer and Vishny1998). Rather, the argument presented here draws on a long tradition in sociology focusing on the advantages of broad networks of weak ties for generating diverse resources (Granovetter Reference Granovetter1973), as well as a literature in comparative politics that points to the role of historical struggles, social dislocations, relational ties, and negotiated institutions as the source of autonomous state power (Moore Reference Moore1967; Mann Reference Mann1984; Evans Reference Evans1995; Waldner Reference Waldner1999).
Markets and networks: empirical puzzles
This chapter is motivated by an empirical puzzle about networks and uncertainty that undermines traditional explanations and suggests that the alternative spelled out above might have more leverage in explaining the emergence of institutional development. Take the comparison of two countries – the Czech Republic and Albania – at opposite extremes of the European post-socialist experience. The former is one of the success stories of transition, ranked as a regional leader in terms of government effectiveness – defined by the World Bank’s “Worldwide governance indicators” as “the quality of public services, the quality of the civil service and the degree of its independence from political pressures, the quality of policy formulation and implementation, and the credibility of the government’s commitment to such policies” (Kaufmann, Kraay, and Mastruzzi Reference Kaufmann, Kraay and Mastruzzi2009). Albania, by contrast, has been the basket case of Europe. In both countries, however, firms express the same level of confidence (high) in their ability to find recourse without resorting to illegal payments in a case when an official acts against the rules (EBRD 2005b).
This surprising result raises more questions than it answers and suggests that there are two different dynamics generating the certainty of recourse, which likely does not have the same significance in both countries. As survey data show in the coming pages, two different orders frame and support market activity and the development of market institutions in these two countries, and we do not have a satisfying account of this process.
Albania and Poland provide another interesting contrast. Poland also ranked among the top regional countries for government effectivness in the late 1990s and 2000s.1 Yet, in Albania, firms find interpretations of the law more consistent and predictable. In fact, on average, they express the highest level of confidence in the sample. Most firms in Poland find them inconsistent and unpredictable (EBRD 2005b). This comparison suggests that the level of institutional performance varies significantly across the region and is not directly linked to the traditional indicators of quality of governance, such as levels of corruption.
In a further example, one of the basic components of a market economy – lending – shows an unexpected difference and dynamic in the last pair of countries. Albanian banks carry half as many non-performing loans on their balance sheets as (often partly party-owned) Polish banks, despite lending approximately the same percentage of GDP. This may be because Polish banks undertake more risky lending based on network ties. In fact, Polish firms use network sources of finance as a key source of investment capital, according to BEEPs (EBRD 2005b).
These cases could not be more different in most dimensions, and thus they make clear that there is good reason to revisit assumptions about the mechanisms that link networks and network-based practices, uncertainty, and institutional development in order to understand the divergence we now see across the region.
All the comparisons above highlight the different foundations on which interactions between firms and the state are structured. As discussed in the Introduction, the early literature on institutional reform in post-socialist states identified a core set of desirable features in this relationship. One key feature was an emphasis on the sociological dimensions of the Washington Consensus: disruption of network ties and state autonomy. These were critical components of the move toward privatization, liberalization, deregulation, fiscal discipline, and the withdrawal of subsidy spending associated with planned or coordinated market economies. Scholarship on corruption also broadly supported convergence on a set of institutions associated with market liberalism.2 Deviations from these goals, it was argued, generated pathologies of reform (Hellman Reference Hellman1998; Hellman, Jones, and Kaufmann Reference Hellman, Jones and Kaufmann2003). Arguments in these literatures became heavily politicized and came to reflect dominant positions in the debate on the Washington Consensus package of reforms.3 Along the way, much of the complexity of models of economic development emerging in the post-socialist region was lost.
This chapter shows that a variety of novel solutions to the fundamental problem of economic transition have emerged in each of the eleven countries surveyed. In some countries firms and politicians turned to networks, while in others they individually turned to the state. For example, medium and large firms use network ties to existing customers as the leading source of new business in Poland, while the government primarily performs this function in Hungary (EBRD 2005b). Although horizontal network ties support business in the former, vertical ties do so in the latter.
I have identified two key features in previous chapters that broadly distinguish countries: network breadth and uncertainty. I categorize state types by the combination of these two dimensions. Each possible pairing shapes the payoffs of making long-term investments in building institutions. As a result, each combination generates a different state type. The next section empirically explores this typology, and the final section shows that each state type has an impact on the institutional development that takes place.
Data and methods
The analysis of state types is based on two factors: (1) the extent to which networks that link the state and the market are narrow or broad; and (2) the extent to which the future is uncertain for economic and political actors. These are latent qualities, however, that can be accessed only by using data that function as manifestations of broader characteristics in each national system (Shawn and Simon Reference Shawn and Simon2008). To capture these latent qualities, one must construct country-level measures based on more concrete manifestations. Two key methods, factor analysis and cluster analysis, are available to build measures that capture the latent qualities of countries on the basis of sets of more directly measureable variables. Factor analysis is useful in generating latent measures out of similar variables, assembling them into a single new variable. Cluster analysis is deployed here because it captures latent similarity among cases. In other words, it accomplishes exactly what is called for by assembling similar groups of cases based on a set of variables that describe them. These cases share a latent characteristic that emerges from the mosaic of values on the underlying variables (Aldenderfer and Blashfield Reference Aldenderfer and Blashfield1984; Kaufman and Rousseeuw Reference Kaufman and Rousseeuw1990). Cluster analysis thus permits the identification of groups of cases based on the values that together express the level of uncertainty and the breadth of social networks in each case.
The breadth of networks and uncertainty are explored in this chapter by the use of data from the survey conducted by the EBRD in 2005 (EBRD 2005b). Numerous data sources provide insight into the nature of state–business interaction and reflect the level of cooperation, accountability, stability, and predictability of this relationship. Such indicators are not without flaws, however. For example, surveys whose purpose is to study state capture more easily detect administrative corruption, because respondents have much more contact with low-level corruption than high-level capture and tend to infer the presence of the latter from the former (Knack Reference Knack2006). Despite such drawbacks, firms are a leading source of information on government political and bureaucratic conduct, and the survey responses they provide offer hard evidence about the nature of interaction with the state. The indicators used also report on the ability of firms to resist and cooperate with both low-level decision makers and high-level political actors on an everyday basis.
Using cluster analysis on social linkage indicators and on levels of uncertainty, state types can be created to group countries that are most similar. There are many variants of clustering methods, which use different procedures to join cases into groups. The two most commonly applied methods, hierarchical and k-means cluster analysis, generate similar results for the data used here. Three robust groups of countries emerge. One of the countries, Albania, is an outlier on many measures. The analysis was conducted both with and without Albania to confirm that the pull of its extreme values did not affecting the clustering solutions.
Cluster analysis requires the scholar to make a decision about the clustering method and the distance measurement used to assess similarity between cases. The scaling of variables has been thought to influence clustering outcomes by giving more weight to variables with larger scales, while some have found that standardization does not affect results in most cases (Aldenderfer and Blashfield Reference Aldenderfer and Blashfield1984). All analyses were performed with variables standardized to z-scores to neutralize any effect that different scales may have and compared to results on unstandardized variables. Cluster assignments remained robust.
Variables
In the pages that follow, results are reported from clustering cases using questions that measure network breadth and uncertainty. The analysis was conducted with questions from the 2005 BEEPS data (EBRD 2005b) that reveal the importance of networks to firm interactions with political actors. Although the questions ask about individual firm perceptions and behavior, aggregated they reveal the role that networks play in firm interactions in a given country. The following variables were created.
SUPP, a variable that captures the stability of firm–firm networks. The question asks if firms would continue to use a supplier despite a significant price rise. I interpret persistent customer–supplier ties despite a price increase to mean that economic relationships between firms exist in the context of other types of ties that bind firms to each other. The extent to which firms choose not to switch suppliers in spite of economic motivations (rising cost) reveals the degree to which firm–firm networks underpin economic activity. Higher values indicate that firm–firm networks are broader.
NETFIN, a variable that expresses the extent to which firms obtain working capital from network sources (informal sources, friends, state-owned banks, credit from customers, and credit from suppliers) as opposed to market sources (foreign banks, private banks, and equity markets). Higher values indicate broader networks.
BUSORG, a variable that captures the extent to which business organizations are valuable in lobbying business. High values indicate that more firms use collective bodies for interest expression. In other words, networks between firms are broader.
A second set of indicators was developed to assess the uncertainty that firms and parties face. For this analysis, the following variables were used.
COMPET, a variable that expresses the number of competitors firms face in the national market. Higher values indicate high levels of competition, and thus uncertainty in the market.
TAXINS, a variable that captures the frequency of annual inspections by the tax authority and thus another element of uncertainty that firms face. Higher levels indicate frequent inspections.
IDTURN, a variable that captures the extent to which ideological turnovers, as opposed to simply leadership turnover, of the party in power are a source of institutional uncertainty for firms (Horowitz, Hoff, and Milanovic Reference Horowitz, Hoff and Milanovic2009). Ideological turnovers are turnovers across the ideological divide. Higher values indicate more frequent turnover. The choice of ideological turnover is discussed in Chapter 1. Briefly, ideological turnover captures the number of political events that disrupt the networks linking firms to power holders.
Three groupings of countries emerge when these variables are clustered together.4 Cluster centers are reported in Table 6.1. These are interpreted as the mean score of a value for a cluster on a given variable. Traditional significance tests are not available or appropriate for cluster analysis, as the analysis itself is designed to find the most significant cluster possible (Aldenderfer and Blashfield Reference Aldenderfer and Blashfield1984; Everitt, Landau, and Leese Reference Everitt, Landau and Leese2011).
Table 6.1 Networks and uncertainty in the Baltics, east central Europe, and the Balkans

Note: Final cluster center scores.
Cluster analysis differentiates the way that networks and uncertainty are present to create three groupings. Cluster 1, the grouping of concertation states, is marked by broad networks and high levels of uncertainty. In these countries, firm–firm networks are very stable. This is shown by the above-average use of business organizations and the persistence of customer–supplier networks independent of price levels. On both these variables, cluster 1 has the highest relative values. Firms also make frequent use of network sources of finance. When disaggregated, the data show that firms in cluster 1 make frequent use of informal sources of finance, supplier credit, and state-owned banks. While networks between firms as well as ties to the state typify these economies, business exists in an environment of uncertainty, with high competition between firms and frequent political alternation.
In cluster 2, patronage states, firms have narrow networks and face low levels of uncertainty. They do not use collective organizations, and horizontal ties between them are unstable. Customer–supplier relations are sensitive to price. Network sources of finance are still used by firms, but not as frequently as in cluster 1. Political alternation is also relatively low, and the level of competition between firms is the lowest of the three clusters.
Firms in cluster 3, captured states, have narrow networks and face high levels of uncertainty. The use of collective organizations by firms is low relative to the other clusters, and customer–supplier ties are more sensitive to price than in cluster 1. The exception to this is that network sources of finance are quite commonly used. Disaggregating reveals that firms, particularly in Bulgaria, rely on “family and friends” as sources of capital. Since I consider only medium- and large-sized firms, I interpret this as meaning allied firms and their executives. Supplier credit is also common. These narrow networks coincide with high levels of uncertainty. High political turnover and frequent tax inspections suggest a state that is weak, chaotic, and predatory. In contrast to cluster 1, this uncertainty does not extend to inter-firm competition, which is significantly lower.
The two dimensions in the cluster analysis can be reformatted into the typology proposed in Table 1.1. The resulting classification is shown in Table 6.2.

The analysis groups cases together on political uncertainty that are not normally considered similar, but this follows from the data used here. Uncertainty is composed of three individual components: the level of competition from other firms, the level of intrusion from the state, and the unpredictability of politics. The latter was captured using data on ideological turnovers for each country. Lithuania is thus classified as a case with high uncertainty because it had four ideological turnovers between 1990 and 2005, according to Horowitz, Hoff, and Milanovic (Reference Horowitz, Hoff and Milanovic2009). This is the highest number for the region, achieved only by two other countries: Bulgaria and Hungary. Poland trailed slightly, with three ideological turnovers. By contrast, Latvia had only one ideological turnover, although it had three government turnovers (recompositions of the governing coalition). These were episodes when the majority coalition changed but did not shift across the ideological divide. While Latvia is an example of a country known for government instability, these changes did not take place across the ideological divide. As regards ideological turnover, Latvia has instead been very stable despite frequent recompositions of government. The distinction is important, because we expect changes in government to have a different and arguably less disruptive effect than ideological shifts of power (Horowitz, Hoff, and Milanovic Reference Horowitz, Hoff and Milanovic2009: 121).
Impacts on governance
This section shows how different combinations of network breadth and uncertainty pair with patterns of institution building. Thus, it becomes possible to determine whether, for example, societies in which firms are linked by broad networks but also face higher levels of uncertainty tend to progress to broader institutional development than those in which networks are narrow and uncertainty is high.
External factors have driven some countries in the post-communist region to move ahead on institutional reform in specific areas. Given the external pressure for reform and liberalization related to European Union accession, according to the EBRD, trade and foreign exchange liberalization are at high levels across the region. Nevertheless, there are significant differences between the clusters. Averages across six policy areas – enterprise restructuring, price liberalization, trade and foreign exchange policy, competition policy, banking reform and interest rate liberalization, and securities market and non-bank financial institution reform – show that the three clusters have performed as expected.
The following graphs of outcome variables show only small numerical differences between clusters. The differences between whole numbers in the EBRD scoring scheme represent big outcome differences, however. The EBRD’s scoring system rates countries on different policy areas on a scale ranging from 1 to 4+. With minor differences between the policy areas, a 1 indicates little progress from a planned economy or an absence of policy in a given area. A 2 indicates the existence of some institutions, while a 3 indicates “some progress” in the development of a regulatory framework. A 4 means that the policy framework approaches Western standards, while a 4+ indicates a framework on the level of advanced industrial countries. The difference between a 2 and a 4 is therefore enormous. Figure 6.1 shows that captured states have made the least progress. Patron states are also in the same general category of reform, although they have made slightly more progress. Concertation states are in the highest category. The large difference between the concertation and captured cluster, for example, indicates a sizeable gap between the quality and implementation of policy frameworks in countries belonging to the two clusters.

Figure 6.1 Progress on six major policy areas, 1990–2005
The clusters vary especially when compared on areas of policy that are largely determined by factions. For example, institutional reforms that regulate the internal market framework and are more easily subject to pressure from interest groups display more variance, and countries from the same wave of EU integration, such as Poland, Hungary, and the Czech Republic, or Romania and Bulgaria, score differently from each other. This is consistent with the literature on the impact of EU expansion discussed in Chapter 1.
Competition policy
One major indicator that can be used to judge the impact of firms on the state is the progress that a country has made on competition policy. Competition policy and the structures that enforce it by definition harm the interests of insiders, so the development of a competent body that monitors and enforces such policies requires the support of a broad coalition of firms. The EBRD “Transition indicators” provide a comparative measure of progress on competition policy. There is a range of outcomes across the typology presented in Figure 6.2. As predicted above, where networks are strong and uncertainty is highest – the concertation states – progress on competition policy is greatest. Differences across full integers represent large differences in outcome.5

Figure 6.2 Competition policy, 2000–2005
Recapitulating the mechanisms at work here, the enforcement of competition policy is taken as a result of the struggles of diverse groups to create an institution that “levels the playing field.” Thus, competition policy is also a good indicator of the distribution of the power of groups. Where progress is made, competing factions have brokered a structure to make sure that all parties stick to the rules of the market and abide by whatever joint conception of fair competitive practices obtain in a given context. Where such structures are lacking, one group of insiders is likely to dominate and block the development of competition enforcement. These results are in line with the argument that concertation states, with broad networks and high levels of uncertainty stemming from a rapid development of institutions and frequent political turnovers, have competing factions of business elites who gradually recognize the benefits of an enforcement authority that reduces selective benefits. By contrast, in patronage states, there are much weaker incentives to build such leveling institutions. Captured states have the weakest incentives for collective action. In Bulgaria, when the business community attempted to coordinate and create an institutional infrastructure that would provide stability for repeated interactions, the attempts repeatedly broke down as calculations about future political counterparts became difficult to make and dominant firms were unable to look beyond their very short time horizons.
Financial institutions and secured transactions policy
As seen in Figure 6.3, securities market and non-bank financial institution reform shows similar divergence in the amount of reform undertaken.6 The ability to regulate securities transactions and safeguard the rights of minority shareholders is a critical component of sophisticated markets, giving firms the ability to raise capital and reassuring shareholders that their interests will be protected. Thus, this is another variable that measures the extent to which the framework benefits the interests of broad versus narrow coalitions. Although standards in the region fall below the level of advanced industrialized countries, in the case of concertation states we see a development of institutions that protect minority shareholder rights, settlement procedures, and a regulatory framework.

Figure 6.3 Securities market and non-bank financial institution reform, 2000–2005
Banking
Differences are also to be found in banking law, although they are narrower than in the two prior areas, as shown in Figure 6.4.7 Again, concertation states lead in the area of banking reform.

Figure 6.4 Banking regulation reform, 2000–2005
Rule of law
A final broad measure that sustains the findings of this chapter is drawn from the World Bank “Worldwide governance indicators” of the rule of law, as shown in Figure 6.5. This indicator expresses the extent to which the rule of law is applied equally to all affected parties, ranging from –2.5 to 2.5. It captures the extent to which “agents have confidence in and abide by the rules of society, and in particular the quality of contract enforcement, property rights, the police, and the courts, as well as the likelihood of crime and violence” (Kaufmann, Kraay, and Mastruzzi Reference Kaufmann, Kraay and Mastruzzi2009). This is a composite measure that also includes factors such as trust in the police that are not relevant here. Nevertheless, quite a few of the components of the rule of law indicator give a sense of the selective or broad nature of institutions emerging in each cluster.

Figure 6.5 Rule of law by cluster
Concertation states were significantly more advanced on this measure after a decade of reform but had lost ground by 2005. Poland and Hungary both received weaker scores in the latter year, driving down the result for the whole cluster. As a result, the difference between the concertation states cluster and the patronage states cluster is not likely to be significant by the end of the period. This raises an interesting question about why patronage states have done surprisingly well on the development of the rule of law. One possible explanation is that patronage states may have reasons to develop the rule of law despite the disproportionate power of political actors because the political elite still depend on firms to generate revenue and thus have some incentives to provide an institutional framework that can support market activity. I discuss this further in the conclusion. Captured states trail dramatically on this indicator.
Conclusion
This chapter grouped together post-communist countries on the basis of two characteristics: (1) the extent to which networks are narrow insider networks or broad heterogeneous networks; and (2) the predictability of the environment in which firms operate. Four groups were posited and countries then placed into a typology that expressed variation along these dimensions. Once clusters were identified, it was demonstrated that membership in a cluster has significant and, in the case of several clusters, unexpected impacts.
Three principal findings emerge from the large-n analysis. First, unsurprisingly, captured states have performed poorly in the development of institutions that serve the broad interest. Narrow societal networks and high levels of uncertainty have given narrow groupings the ability to influence the course of institutional development.
With regard to patronage states, one might expect them to perform as poorly as captured states. The second finding of the large-n analysis is that patronage states fall between captured and concertation states on measures of institutional development. On some dimensions, such as the development of the rule of law, they perform as well as concertation states by the end of the period under observation. They also fall between captured and concertation states in the development of competition policy and securities market regulation, however. How can we interpret this result? In patronage states, political elites are able to dominate economic elites because of narrow networks and low levels of uncertainty. Nevertheless, political elites in patronage states have an interest in institutional development because they rely on funds extracted from business. Patrons are both grantors of benefits and extractors of resources. To this end, institutional development is useful for promoting business performance. As outlined by Greif, Milgrom, and Weingast (Reference Greif, Milgrom and Weingast1994), rulers must tie their own hands with institutionalized procedures to be able to extract resources effectively. Patronage states have undertaken some institutional development in order to facilitate economic development because they rely on business for resources. This impetus for institutional performance is not as great as in the concertation states, however, because of the lower level of party competition and the narrowness of business networks. The third finding, which supports the argument made in earlier chapters, is that the combination of high uncertainty and broad networks correlates strongly with countries that have the highest levels of institutional development of the three clusters identified in the analysis.
1 Poland’s ranking for governance effectiveness declined somewhat with the entrance of a new set of political parties that governed in a chaotic fashion.
2 The literature here is vast. Some prominent exponents of this view are Rose-Ackerman (Reference Rose-Ackerman1999), Shleifer and Vishny (2002), and Holmes (Reference Holmes2006).
3 Authors have noted this in other regions of the world as well. See, for example, Serra and Stiglitz (Reference Serra and Stiglitz2008).
4 Multiple cluster solutions were explored. The explanatory power of a three-cluster solution was confirmed by referring to pseudo-F values, which capture the increase or decrease in fit of 1 to n-cluster solutions.
5 Competition policy reform is scored by the EBRD as follows.

6 Securities market and non-bank financial institution reform is scored by the EBRD as follows.

7 Banking regulation reform is scored by the EBRD as follows.


 Open access