1 Introduction
Emulsions of immiscible liquids appear in many natural, biological and industrial phenomena. Their flows are determined by the microstructure of the constituting phases. The overall rheology connecting the flow properties to the coevolving microstructure has been extensively investigated and modelled (Tucker & Moldenaers Reference Tucker and Moldenaers2002). However, previous studies neglected inertia in both the dispersed and the matrix phases. Recently, we investigated the effects of small drop-level inertia on a dilute emulsion of viscous drops and discovered that inertia can change the sign of the first and second normal stress differences (Li & Sarkar Reference Li and Sarkar2005b ). Here, we extend that study to concentrated emulsions of moderate volume fractions. Through direct numerical simulation, we investigate how drop–drop interactions affect the steady shear rheology, in particular the anomalous sign change of the normal stress differences.
Research on the effective rheology of suspensions and emulsions has an illustrious history, starting with the seminal work of Einstein (Reference Einstein1906). He predicted that the effective viscosity of a dilute rigid sphere suspension increases linearly with the volume fraction
![]() $\unicode[STIX]{x1D719}$
, namely
$\unicode[STIX]{x1D719}$
, namely
![]() $\unicode[STIX]{x1D707}_{effective}=\unicode[STIX]{x1D707}_{m}(1+2.5\unicode[STIX]{x1D719})$
, where
$\unicode[STIX]{x1D707}_{effective}=\unicode[STIX]{x1D707}_{m}(1+2.5\unicode[STIX]{x1D719})$
, where
![]() $\unicode[STIX]{x1D707}_{m}$
is the viscosity of the suspending liquid. Taylor (Reference Taylor1932) extended this to an emulsion of spherical viscous drops with a ratio
$\unicode[STIX]{x1D707}_{m}$
is the viscosity of the suspending liquid. Taylor (Reference Taylor1932) extended this to an emulsion of spherical viscous drops with a ratio
![]() $\unicode[STIX]{x1D706}$
of the drop to matrix viscosities:
$\unicode[STIX]{x1D706}$
of the drop to matrix viscosities:
![]() $\unicode[STIX]{x1D707}_{effective}=\unicode[STIX]{x1D707}_{m}[1+2.5\unicode[STIX]{x1D719}(\unicode[STIX]{x1D706}+0.4)/(\unicode[STIX]{x1D706}+1)]$
. Using a perturbation method, Oldroyd (Reference Oldroyd1953) obtained a linear Jeffrey-type viscoelastic constitutive equation for time varying flows with explicit expressions for the relaxation and retardation times (both proportional to the capillary time scale of the drop). Schowalter, Chaffey & Brenner (Reference Schowalter, Chaffey and Brenner1968) were the first to consider the first-order effects of drop deformation on steady shear rheology, obtaining a positive first normal stress difference
$\unicode[STIX]{x1D707}_{effective}=\unicode[STIX]{x1D707}_{m}[1+2.5\unicode[STIX]{x1D719}(\unicode[STIX]{x1D706}+0.4)/(\unicode[STIX]{x1D706}+1)]$
. Using a perturbation method, Oldroyd (Reference Oldroyd1953) obtained a linear Jeffrey-type viscoelastic constitutive equation for time varying flows with explicit expressions for the relaxation and retardation times (both proportional to the capillary time scale of the drop). Schowalter, Chaffey & Brenner (Reference Schowalter, Chaffey and Brenner1968) were the first to consider the first-order effects of drop deformation on steady shear rheology, obtaining a positive first normal stress difference
![]() $N_{1}$
and a negative second normal stress difference
$N_{1}$
and a negative second normal stress difference
![]() $N_{2}$
, both proportional to
$N_{2}$
, both proportional to
![]() $\dot{\unicode[STIX]{x1D6FE}}^{2}$
, square of the shear rate. Frankel & Acrivos (Reference Frankel and Acrivos1970) generalized the result to obtain an expression for the stress tensor of an emulsion in time-dependent shear. All of the above investigations neglected interactions between drops, obtaining results of first order in the volume fraction
$\dot{\unicode[STIX]{x1D6FE}}^{2}$
, square of the shear rate. Frankel & Acrivos (Reference Frankel and Acrivos1970) generalized the result to obtain an expression for the stress tensor of an emulsion in time-dependent shear. All of the above investigations neglected interactions between drops, obtaining results of first order in the volume fraction
![]() $\unicode[STIX]{x1D719}$
. A
$\unicode[STIX]{x1D719}$
. A
![]() $\unicode[STIX]{x1D719}^{2}$
correction to the expressions was obtained by Choi & Schowalter (Reference Choi and Schowalter1975), considering a cell model for interactions with neighbouring drops. The physics of the interaction between many drops beyond such perturbative analysis can only be investigated by numerical simulation.
$\unicode[STIX]{x1D719}^{2}$
correction to the expressions was obtained by Choi & Schowalter (Reference Choi and Schowalter1975), considering a cell model for interactions with neighbouring drops. The physics of the interaction between many drops beyond such perturbative analysis can only be investigated by numerical simulation.
It should be noted that in the one-particle dilute limit without any interactions, a rigid sphere suspension does not have any viscoelastic effect. Concentrated suspensions have been subjected to rigorous numerical investigation using Stokesian dynamics (Brady & Bossis Reference Brady and Bossis1988). This technique can accurately simulate hydrodynamic interactions between multiple particles, offering an excellent match between predictions and experimental observations. Interactions result in a viscoelastic behaviour with non-zero normal stress differences due to shear induced asymmetry in the particle distribution. Under different conditions, the effective viscoelasticity changes in the presence of hydrodynamic forces and interactions. At low Péclet numbers, where Brownian forces dominate the hydrodynamic forces, suspensions exhibit shear thinning, a positive first normal stress difference and a negative second normal stress difference. Strong hydrodynamic forces at higher Péclet number give rise to shear thickening due to the formation of hydrodynamic clusters and a negative first normal stress difference (Phung, Brady & Bossis Reference Phung, Brady and Bossis1996; Foss & Brady Reference Foss and Brady2000).
In contrast to rigid particle suspensions, concentrated emulsions have attracted far fewer numerical simulations. Unlike their rigid counterparts, drops in an emulsion undergo deformation as well as coalescence and breakup, making such simulations difficult. This partly explains the relative sparsity of the literature. Most simulations of emulsions, including the current study, do not account for coalescence or breakup. Zhou & Pozrikidis (Reference Zhou and Pozrikidis1993) simulated two-dimensional random and periodic emulsions in a channel using the boundary element method (BEM). Loewenberg & Hinch (Reference Loewenberg and Hinch1996) used the same technique in three dimensions to simulate a concentrated emulsion in free shear and obtained the rheology – shear thinning, a positive first normal stress difference and a negative second normal stress difference. More recently, Zinchenko & Davis (Reference Zinchenko and Davis2000) developed a highly accurate and efficient BEM algorithm, introducing multipole techniques that allowed simulations of
![]() ${\sim}100$
drops with
${\sim}100$
drops with
![]() ${\sim}1000$
nodes per drop. A larger number of drops was found to be necessary for accurate estimation of average properties for highly concentrated emulsions (
${\sim}1000$
nodes per drop. A larger number of drops was found to be necessary for accurate estimation of average properties for highly concentrated emulsions (
![]() ${>}50\,\%$
). For such systems, most of the shear thinning was found to occur sharply at the lowest capillary number (nearly non-deformed drops) (Zinchenko & Davis Reference Zinchenko and Davis2002, Reference Zinchenko and Davis2015).
${>}50\,\%$
). For such systems, most of the shear thinning was found to occur sharply at the lowest capillary number (nearly non-deformed drops) (Zinchenko & Davis Reference Zinchenko and Davis2002, Reference Zinchenko and Davis2015).
Apart from direct numerical simulations, there have been semi-phenomenological approaches to modelling emulsion rheology using general physical features of the microstructure that can account for changes in structural topology arising from coalescence and breakup. Using the interface tensor that describes the effects of drop deformation on rheology first introduced by Batchelor (Reference Batchelor1970), Doi & Ohta (Reference Doi and Ohta1991) developed a theory for a bicontinuous equal-viscosity blend. They offered a time evolution equation for the interface tensor, containing two additive tensorial contributions from capillary relaxation due to surface tension and flow mediated deformation. The model predicted a linear scaling for both the shear (
![]() $\unicode[STIX]{x1D70E}_{12}\propto \dot{\unicode[STIX]{x1D6FE}}$
) and the first normal stress difference
$\unicode[STIX]{x1D70E}_{12}\propto \dot{\unicode[STIX]{x1D6FE}}$
) and the first normal stress difference
![]() $(N_{1}\propto |\dot{\unicode[STIX]{x1D6FE}}|)$
(in contrast to
$(N_{1}\propto |\dot{\unicode[STIX]{x1D6FE}}|)$
(in contrast to
![]() $N_{1}\propto \dot{\unicode[STIX]{x1D6FE}}^{2}$
in more conventional theory). The anomalous scaling stems from the kinematic origin of its length scale – droplet size proportional to
$N_{1}\propto \dot{\unicode[STIX]{x1D6FE}}^{2}$
in more conventional theory). The anomalous scaling stems from the kinematic origin of its length scale – droplet size proportional to
![]() $1/\dot{\unicode[STIX]{x1D6FE}}$
determined by coalescence and breakup – and has been observed experimentally (Takahashi et al.
Reference Takahashi, Kurashima, Noda and Doi1994; Vinckier, Moldenaers & Mewis Reference Vinckier, Moldenaers and Mewis1996). However, the theory is inappropriate for blends with droplet-like microstructure, and has seen modifications to account for such effects (Lee & Park Reference Lee and Park1994; Peters, Hansen & Meijer Reference Peters, Hansen and Meijer2001). Almusallam and coworkers (Almusallam, Larson & Solomon Reference Almusallam, Larson and Solomon2000) further improved the theory, including phenomenological ellipsoidal models for droplet shapes (Maffettone & Minale Reference Maffettone and Minale1998; Wetzel & Tucker Reference Wetzel and Tucker2001; Jackson & Tucker Reference Jackson and Tucker2003).
$1/\dot{\unicode[STIX]{x1D6FE}}$
determined by coalescence and breakup – and has been observed experimentally (Takahashi et al.
Reference Takahashi, Kurashima, Noda and Doi1994; Vinckier, Moldenaers & Mewis Reference Vinckier, Moldenaers and Mewis1996). However, the theory is inappropriate for blends with droplet-like microstructure, and has seen modifications to account for such effects (Lee & Park Reference Lee and Park1994; Peters, Hansen & Meijer Reference Peters, Hansen and Meijer2001). Almusallam and coworkers (Almusallam, Larson & Solomon Reference Almusallam, Larson and Solomon2000) further improved the theory, including phenomenological ellipsoidal models for droplet shapes (Maffettone & Minale Reference Maffettone and Minale1998; Wetzel & Tucker Reference Wetzel and Tucker2001; Jackson & Tucker Reference Jackson and Tucker2003).
Investigation of the effective rheology of suspensions and emulsions has largely been restricted to inertialess Stokes flow. Lin, Peery & Showalter (Reference Lin, Peery and Showalter1970) used an asymptotic technique to model the effects of finite particle level inertia on the rheology of a dilute rigid particle suspension, finding a negative first normal stress difference and a positive second normal stress difference. Patankar & Hu (Reference Patankar and Hu2002) performed a two-dimensional simulation for the same system, finding again a negative first normal stress difference and a shear thickening behaviour. A two-dimensional lattice–Boltzmann (LBM) simulation of rigid sphere suspensions at finite inertia showed shear thickening and formation of clusters that increased initially with increasing Reynolds number before breaking up at larger inertia,
![]() $Re\sim 10$
(Raiskinmaki et al.
Reference Raiskinmaki, Astrom, Kataja, Latva-Kokko, Koponen, Jasberg, Shakib-Manesh and Timonen2003). Morris and coworkers also used an LBM simulation and found the simulated normal stress differences to behave in accord with the analytical results of Lin et al. at low concentration
$Re\sim 10$
(Raiskinmaki et al.
Reference Raiskinmaki, Astrom, Kataja, Latva-Kokko, Koponen, Jasberg, Shakib-Manesh and Timonen2003). Morris and coworkers also used an LBM simulation and found the simulated normal stress differences to behave in accord with the analytical results of Lin et al. at low concentration
![]() $(\unicode[STIX]{x1D719}<0.1)$
as functions of the particle concentration and Reynolds number (Kulkarni & Morris Reference Kulkarni and Morris2008; Haddadi & Morris Reference Haddadi and Morris2014). However, for
$(\unicode[STIX]{x1D719}<0.1)$
as functions of the particle concentration and Reynolds number (Kulkarni & Morris Reference Kulkarni and Morris2008; Haddadi & Morris Reference Haddadi and Morris2014). However, for
![]() $\unicode[STIX]{x1D719}\geqslant 0.2~\text{s}$
the second normal stress difference becomes negative at low Re. It should be noted that LBM simulation has also been used to compute the rheology of a similar but more complex system, namely a suspension of capsules enclosed by an elastic membrane (Clausen, Reasor & Aidun Reference Clausen, Reasor and Aidun2011). The authors noted that the deformability of the capsules changes the sign of the first normal stress difference from negative – the same as for a rigid particle suspension – to positive – the same as for an emulsion of viscous drops – both in the Stokes limit.
$\unicode[STIX]{x1D719}\geqslant 0.2~\text{s}$
the second normal stress difference becomes negative at low Re. It should be noted that LBM simulation has also been used to compute the rheology of a similar but more complex system, namely a suspension of capsules enclosed by an elastic membrane (Clausen, Reasor & Aidun Reference Clausen, Reasor and Aidun2011). The authors noted that the deformability of the capsules changes the sign of the first normal stress difference from negative – the same as for a rigid particle suspension – to positive – the same as for an emulsion of viscous drops – both in the Stokes limit.
As mentioned above, we have previously investigated dilute rheology (i.e. based on the flow field around a single drop) using a front-tracking method, predicting reversal of the signs of the normal stress differences with increasing Reynolds number (Li & Sarkar Reference Li and Sarkar2005b
). This was followed up by a perturbative analysis by Subramaniam and coworkers (Raja, Subramanian & Koch Reference Raja, Subramanian and Koch2010; Subramanian et al.
Reference Subramanian, Koch, Zhang and Yang2011), providing an analytical confirmation of the sign reversal. This phenomenon stems from a purely geometric effect – a drop in shear reaches an inclination in excess of
![]() $45^{\circ }$
with the flow direction at finite Reynolds number (Singh & Sarkar Reference Singh and Sarkar2011). We also found negative normal stress elasticity in the effective oscillating extensional rheology (Li & Sarkar Reference Li and Sarkar2005c
,Reference Li and Sarkar
d
). These studies have, however, been limited to a dilute system, i.e. non-interacting drops. Here, we study the rheology of a concentrated emulsion with a moderate volume fraction (5–27 %) in the presence of inertia, systematically varying the capillary number (0.02–0.2) and drop-scale Reynolds number (0.1–10). In the interest of brevity, we restrict the current study to a density- and viscosity-matched case, although the more general case does not pose any additional challenge for the computational methodology. A message passing interface (MPI) based parallel code incorporating a front-tracking algorithm (Bunner & Tryggvason Reference Bunner and Tryggvason1999) is used for simulating this problem. The rheology, i.e. the effective stresses in the emulsion, is calculated using the stress formulation of Batchelor (Reference Batchelor1970).
$45^{\circ }$
with the flow direction at finite Reynolds number (Singh & Sarkar Reference Singh and Sarkar2011). We also found negative normal stress elasticity in the effective oscillating extensional rheology (Li & Sarkar Reference Li and Sarkar2005c
,Reference Li and Sarkar
d
). These studies have, however, been limited to a dilute system, i.e. non-interacting drops. Here, we study the rheology of a concentrated emulsion with a moderate volume fraction (5–27 %) in the presence of inertia, systematically varying the capillary number (0.02–0.2) and drop-scale Reynolds number (0.1–10). In the interest of brevity, we restrict the current study to a density- and viscosity-matched case, although the more general case does not pose any additional challenge for the computational methodology. A message passing interface (MPI) based parallel code incorporating a front-tracking algorithm (Bunner & Tryggvason Reference Bunner and Tryggvason1999) is used for simulating this problem. The rheology, i.e. the effective stresses in the emulsion, is calculated using the stress formulation of Batchelor (Reference Batchelor1970).
2 Mathematical formulation
2.1 Governing equations and numerical formulation
The governing equations for the suspending liquid and the drops are the incompressible Navier–Stokes equations:
 $$\begin{eqnarray}\left.\begin{array}{@{}c@{}}\displaystyle \unicode[STIX]{x1D735}\boldsymbol{\cdot }\boldsymbol{u}=0,\\ \displaystyle \frac{\unicode[STIX]{x2202}(\unicode[STIX]{x1D70C}\boldsymbol{u})}{\unicode[STIX]{x2202}t}+\unicode[STIX]{x1D735}\boldsymbol{\cdot }(\unicode[STIX]{x1D70C}\boldsymbol{u}\boldsymbol{u})=-\unicode[STIX]{x1D735}p+\unicode[STIX]{x1D735}\boldsymbol{\cdot }[\unicode[STIX]{x1D707}\{\unicode[STIX]{x1D735}\boldsymbol{u}+(\unicode[STIX]{x1D735}\boldsymbol{u})^{T}\}]-\int _{\unicode[STIX]{x2202}B}\unicode[STIX]{x1D705}\boldsymbol{n}\unicode[STIX]{x1D6E4}\unicode[STIX]{x1D6FF}(\boldsymbol{x}-\boldsymbol{x}^{\prime })\,\text{d}S(\boldsymbol{x}^{\prime }).\end{array}\right\}\end{eqnarray}$$
In the above equations,
![]() $\boldsymbol{u}$
,
$\boldsymbol{u}$
,
![]() $p$
,
$p$
,
![]() $\unicode[STIX]{x1D70C}$
and
$\unicode[STIX]{x1D70C}$
and
![]() $\unicode[STIX]{x1D707}$
represent the velocity, pressure, density and viscosity respectively,
$\unicode[STIX]{x1D707}$
represent the velocity, pressure, density and viscosity respectively,
![]() $\unicode[STIX]{x1D705}$
is the local drop surface curvature,
$\unicode[STIX]{x1D705}$
is the local drop surface curvature,
![]() $\boldsymbol{n}$
is the unit outward normal to the surface
$\boldsymbol{n}$
is the unit outward normal to the surface
![]() $\unicode[STIX]{x2202}B$
of all drops and
$\unicode[STIX]{x2202}B$
of all drops and
![]() $\unicode[STIX]{x1D6E4}$
is the interfacial tension. The equations are solved using a finite difference based front-tracking method (Bunner & Tryggvason Reference Bunner and Tryggvason1999). It uses MPI libraries for parallel algorithm. The basic numerical method has been developed and used in many problems involving drops in viscous (Sarkar & Schowalter Reference Sarkar and Schowalter2001; Li & Sarkar Reference Li and Sarkar2005c
,Reference Li and Sarkar
d
, Reference Li and Sarkar2006) and viscoelastic (Sarkar & Schowalter Reference Sarkar and Schowalter2000; Aggarwal & Sarkar Reference Aggarwal and Sarkar2007, Reference Aggarwal and Sarkar2008a
,Reference Aggarwal and Sarkar
b
; Mukherjee & Sarkar Reference Mukherjee and Sarkar2010, Reference Mukherjee and Sarkar2011) media as well as capsules enclosed by an elastic membrane (Li & Sarkar Reference Li and Sarkar2008; Singh, Li & Sarkar Reference Singh, Li and Sarkar2014). Therefore, details will be spared here. Due to the explicit nature of the method, the time stepping of the simulation in the low-Reynolds-number cases here is severely restricted by the viscous time limit
$\unicode[STIX]{x1D6E4}$
is the interfacial tension. The equations are solved using a finite difference based front-tracking method (Bunner & Tryggvason Reference Bunner and Tryggvason1999). It uses MPI libraries for parallel algorithm. The basic numerical method has been developed and used in many problems involving drops in viscous (Sarkar & Schowalter Reference Sarkar and Schowalter2001; Li & Sarkar Reference Li and Sarkar2005c
,Reference Li and Sarkar
d
, Reference Li and Sarkar2006) and viscoelastic (Sarkar & Schowalter Reference Sarkar and Schowalter2000; Aggarwal & Sarkar Reference Aggarwal and Sarkar2007, Reference Aggarwal and Sarkar2008a
,Reference Aggarwal and Sarkar
b
; Mukherjee & Sarkar Reference Mukherjee and Sarkar2010, Reference Mukherjee and Sarkar2011) media as well as capsules enclosed by an elastic membrane (Li & Sarkar Reference Li and Sarkar2008; Singh, Li & Sarkar Reference Singh, Li and Sarkar2014). Therefore, details will be spared here. Due to the explicit nature of the method, the time stepping of the simulation in the low-Reynolds-number cases here is severely restricted by the viscous time limit
![]() $\unicode[STIX]{x1D6E5}(t\dot{\unicode[STIX]{x1D6FE}})<Re\unicode[STIX]{x1D6E5}(x/a)^{2}/6$
, which was partially alleviated by treating some of the viscous terms implicitly using an alternate direction implicit (ADI) scheme. It should be noted that the viscous capillary
$\unicode[STIX]{x1D6E5}(t\dot{\unicode[STIX]{x1D6FE}})<Re\unicode[STIX]{x1D6E5}(x/a)^{2}/6$
, which was partially alleviated by treating some of the viscous terms implicitly using an alternate direction implicit (ADI) scheme. It should be noted that the viscous capillary
![]() $\unicode[STIX]{x1D6E5}(t\dot{\unicode[STIX]{x1D6FE}})<Ca\unicode[STIX]{x1D6E5}(x/a)$
, or inertia capillary
$\unicode[STIX]{x1D6E5}(t\dot{\unicode[STIX]{x1D6FE}})<Ca\unicode[STIX]{x1D6E5}(x/a)$
, or inertia capillary
![]() $\unicode[STIX]{x1D6E5}(t\dot{\unicode[STIX]{x1D6FE}})<(CaRe)^{1/2}\unicode[STIX]{x1D6E5}(x/a)^{3/2}$
(Brackbill, Kothe & Zemach Reference Brackbill, Kothe and Zemach1992), considerations are less restrictive. The computational efficiency of this approach under the parallel methodology was verified. The reader is referred to our previous articles (Sarkar & Schowalter Reference Sarkar and Schowalter2001; Li & Sarkar Reference Li and Sarkar2005a
) for further detail on the serial implementation.
$\unicode[STIX]{x1D6E5}(t\dot{\unicode[STIX]{x1D6FE}})<(CaRe)^{1/2}\unicode[STIX]{x1D6E5}(x/a)^{3/2}$
(Brackbill, Kothe & Zemach Reference Brackbill, Kothe and Zemach1992), considerations are less restrictive. The computational efficiency of this approach under the parallel methodology was verified. The reader is referred to our previous articles (Sarkar & Schowalter Reference Sarkar and Schowalter2001; Li & Sarkar Reference Li and Sarkar2005a
) for further detail on the serial implementation.
The problem consists of multiple Newtonian drops initially all spherical with the same radius
![]() $a$
suspended in a free shear. Computationally, the drops are placed in a domain of dimensions
$a$
suspended in a free shear. Computationally, the drops are placed in a domain of dimensions
![]() $L_{x}\times L_{y}\times L_{z}$
. The effect of finite domain size is investigated. The upper and the bottom walls separated by a distance of
$L_{x}\times L_{y}\times L_{z}$
. The effect of finite domain size is investigated. The upper and the bottom walls separated by a distance of
![]() $L_{y}$
move with velocities
$L_{y}$
move with velocities
![]() $+U$
and
$+U$
and
![]() $-U$
in the
$-U$
in the
![]() $x$
-direction to simulate a uniform velocity gradient of
$x$
-direction to simulate a uniform velocity gradient of
![]() $\dot{\unicode[STIX]{x1D6FE}}=2U/L_{y}$
(figure 1). Periodic boundary conditions are applied in the flow
$\dot{\unicode[STIX]{x1D6FE}}=2U/L_{y}$
(figure 1). Periodic boundary conditions are applied in the flow
![]() $(x)$
and vorticity
$(x)$
and vorticity
![]() $(z)$
directions. By non-dimensionalizing the problem using the length scale
$(z)$
directions. By non-dimensionalizing the problem using the length scale
![]() $a$
and the time scale
$a$
and the time scale
![]() $\dot{\unicode[STIX]{x1D6FE}}^{-1}$
one obtains several non-dimensional parameters: the Reynolds number
$\dot{\unicode[STIX]{x1D6FE}}^{-1}$
one obtains several non-dimensional parameters: the Reynolds number
![]() $Re=\unicode[STIX]{x1D70C}\dot{\unicode[STIX]{x1D6FE}}a^{2}/\unicode[STIX]{x1D707}$
and the capillary number
$Re=\unicode[STIX]{x1D70C}\dot{\unicode[STIX]{x1D6FE}}a^{2}/\unicode[STIX]{x1D707}$
and the capillary number
![]() $Ca=\unicode[STIX]{x1D707}\dot{\unicode[STIX]{x1D6FE}}a/\unicode[STIX]{x1D6E4}$
. The viscosity and density ratios
$Ca=\unicode[STIX]{x1D707}\dot{\unicode[STIX]{x1D6FE}}a/\unicode[STIX]{x1D6E4}$
. The viscosity and density ratios
![]() $\unicode[STIX]{x1D706}=\unicode[STIX]{x1D707}_{d}/\unicode[STIX]{x1D707}_{m}$
and
$\unicode[STIX]{x1D706}=\unicode[STIX]{x1D707}_{d}/\unicode[STIX]{x1D707}_{m}$
and
![]() $\unicode[STIX]{x1D706}_{\unicode[STIX]{x1D70C}}=\unicode[STIX]{x1D70C}_{d}/\unicode[STIX]{x1D70C}_{m}$
between the drop and matrix phases are kept at unity here. The volume fraction of the emulsion is
$\unicode[STIX]{x1D706}_{\unicode[STIX]{x1D70C}}=\unicode[STIX]{x1D70C}_{d}/\unicode[STIX]{x1D70C}_{m}$
between the drop and matrix phases are kept at unity here. The volume fraction of the emulsion is
![]() $\unicode[STIX]{x1D719}=4\unicode[STIX]{x03C0}a^{3}N/3V$
;
$\unicode[STIX]{x1D719}=4\unicode[STIX]{x03C0}a^{3}N/3V$
;
![]() $N$
is the number of drops suspended in the volume
$N$
is the number of drops suspended in the volume
![]() $V=L_{x}\times L_{y}\times L_{z}$
. Most simulations, unless otherwise stated, are performed with domain dimensions the same in all directions,
$V=L_{x}\times L_{y}\times L_{z}$
. Most simulations, unless otherwise stated, are performed with domain dimensions the same in all directions,
![]() $L_{x}=L_{y}=L_{z}=L$
, and therefore
$L_{x}=L_{y}=L_{z}=L$
, and therefore
![]() $\unicode[STIX]{x1D719}=4\unicode[STIX]{x03C0}N(a/L)^{3}/3$
.
$\unicode[STIX]{x1D719}=4\unicode[STIX]{x03C0}N(a/L)^{3}/3$
.
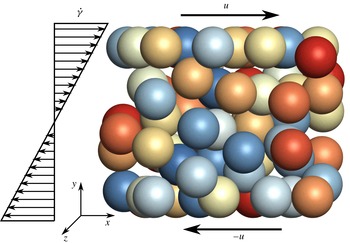
Figure 1. Schematic layout of the computational domain showing the random positions of the drops.
Explicit computation of deforming drops at high concentration can lead to overlap of drops in close proximity. Zinchenko & Davis (Reference Zinchenko and Davis2015) recently implemented a numerical procedure to prevent overlap and discussed how it extended the capabilities of their code and affected the results previously obtained without such a procedure (Zinchenko & Davis Reference Zinchenko and Davis2002). For the concentrations presented here, we did not encounter any difficulty due to overlap. It should also be noted that the smeared interface nature of the front-tracking code alleviates the computational problems in the event of overlap. The code will proceed, albeit with slight error, as the finite difference computation is not directly linked with the front; the front supplies the smeared forces due to the surface tension to the finite difference. The code was executed on the Mills cluster (
![]() $200+$
nodes with AMD6234 processors with
$200+$
nodes with AMD6234 processors with
![]() $24/48$
cores per node, 40 Gbps infiniband network-MPI) at the University of Delaware. Typical cases were simulated using 8, 16 or 64 processors depending on the availability on the cluster. A simulation of 170 inverse shear unit takes 2 weeks on 64 processors and 27 days on 8 processors. However, the simulation duration may vary depending on the load on the system.
$24/48$
cores per node, 40 Gbps infiniband network-MPI) at the University of Delaware. Typical cases were simulated using 8, 16 or 64 processors depending on the availability on the cluster. A simulation of 170 inverse shear unit takes 2 weeks on 64 processors and 27 days on 8 processors. However, the simulation duration may vary depending on the load on the system.
2.2 Effective bulk shear rheology
The bulk stresses of the emulsion are estimated using Batchelor’s formulation (Batchelor Reference Batchelor1970), as was also done in our dilute rheology investigation (Li & Sarkar Reference Li and Sarkar2005b ):
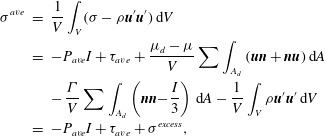 $$\begin{eqnarray}\displaystyle \unicode[STIX]{x1D70E}^{ave} & = & \displaystyle \frac{1}{V}\int _{V}(\unicode[STIX]{x1D70E}-\unicode[STIX]{x1D70C}\boldsymbol{u}^{\prime }\boldsymbol{u}^{\prime })\,\text{d}V\nonumber\\ \displaystyle & = & \displaystyle -P_{ave}I+\unicode[STIX]{x1D70F}_{ave}+\frac{\unicode[STIX]{x1D707}_{d}-\unicode[STIX]{x1D707}}{V}\sum \int _{A_{d}}(\boldsymbol{u}\boldsymbol{n}+\boldsymbol{n}\boldsymbol{u})\,\text{d}A\nonumber\\ \displaystyle & & \displaystyle -\,\frac{\unicode[STIX]{x1D6E4}}{V}\sum \int _{A_{d}}\left(\boldsymbol{n}\boldsymbol{n}-\frac{I}{3}\right)\,\text{d}A-\frac{1}{V}\int _{V}\unicode[STIX]{x1D70C}\boldsymbol{u}^{\prime }\boldsymbol{u}^{\prime }\,\text{d}V\nonumber\\ \displaystyle & = & \displaystyle -P_{ave}I+\unicode[STIX]{x1D70F}_{ave}+\unicode[STIX]{x1D70E}^{excess},\end{eqnarray}$$
where
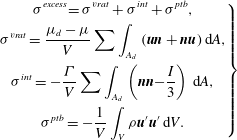 $$\begin{eqnarray}\left.\begin{array}{@{}c@{}}\displaystyle \unicode[STIX]{x1D70E}^{excess}=\unicode[STIX]{x1D70E}^{vrat}+\unicode[STIX]{x1D70E}^{int}+\unicode[STIX]{x1D70E}^{ptb},\\ \displaystyle \unicode[STIX]{x1D70E}^{vrat}=\frac{\unicode[STIX]{x1D707}_{d}-\unicode[STIX]{x1D707}}{V}\sum \int _{A_{d}}(\boldsymbol{u}\boldsymbol{n}+\boldsymbol{n}\boldsymbol{u})\,\text{d}A,\\ \displaystyle \unicode[STIX]{x1D70E}^{int}=-\frac{\unicode[STIX]{x1D6E4}}{V}\sum \int _{A_{d}}\left(\boldsymbol{n}\boldsymbol{n}-\frac{I}{3}\right)\,\text{d}A,\\ \displaystyle \unicode[STIX]{x1D70E}^{ptb}=-\frac{1}{V}\int _{V}\unicode[STIX]{x1D70C}\boldsymbol{u}^{\prime }\boldsymbol{u}^{\prime }\,\text{d}V.\end{array}\right\}\end{eqnarray}$$
Here,
![]() $V$
is the averaging volume (computational domain). It is assumed that the length scale of this volume is smaller than the macroscopic scale of the flow of the emulsion and is much larger than the size of the drops. The term
$V$
is the averaging volume (computational domain). It is assumed that the length scale of this volume is smaller than the macroscopic scale of the flow of the emulsion and is much larger than the size of the drops. The term
![]() $A_{d}$
is the area of a drop and the summation is over all drops. The term
$A_{d}$
is the area of a drop and the summation is over all drops. The term
![]() $P_{ave}$
is the average isotropic pressure and
$P_{ave}$
is the average isotropic pressure and
![]() $\unicode[STIX]{x1D70F}_{ave}$
is the shear stress that would arise from the matrix if the drops were absent. Since the dispersing liquid is Newtonian, this term is easily obtained from its Newtonian constitutive relation. The term
$\unicode[STIX]{x1D70F}_{ave}$
is the shear stress that would arise from the matrix if the drops were absent. Since the dispersing liquid is Newtonian, this term is easily obtained from its Newtonian constitutive relation. The term
![]() $\unicode[STIX]{x1D70E}^{vrat}$
arising from the viscosity difference is zero for a viscosity-matched system, as is the case here. The term
$\unicode[STIX]{x1D70E}^{vrat}$
arising from the viscosity difference is zero for a viscosity-matched system, as is the case here. The term
![]() $\unicode[STIX]{x1D70E}^{int}$
arises from the interfacial tension
$\unicode[STIX]{x1D70E}^{int}$
arises from the interfacial tension
![]() $\unicode[STIX]{x1D6E4}$
at the drop interface. This is a purely geometric quantity determined by the instantaneous shapes of the drops. The term
$\unicode[STIX]{x1D6E4}$
at the drop interface. This is a purely geometric quantity determined by the instantaneous shapes of the drops. The term
![]() $\unicode[STIX]{x1D70E}^{ptb}$
is a Reynolds stress type term; it represents the momentum fluxes due to the disturbances in the velocity field created by the presence of drops. The term
$\unicode[STIX]{x1D70E}^{ptb}$
is a Reynolds stress type term; it represents the momentum fluxes due to the disturbances in the velocity field created by the presence of drops. The term
![]() $u^{\prime }=u-\overline{U}$
is the perturbation velocity, and
$u^{\prime }=u-\overline{U}$
is the perturbation velocity, and
![]() $\overline{U}$
is the mean velocity of the imposed shear flow. For the viscosity-matched system, these two terms represent the excess stress
$\overline{U}$
is the mean velocity of the imposed shear flow. For the viscosity-matched system, these two terms represent the excess stress
![]() $\unicode[STIX]{x1D70E}^{excess}=\unicode[STIX]{x1D70E}^{int}+\unicode[STIX]{x1D70E}^{ptb}$
due to the presence of drops. After computing them, the steady shear rheology of the emulsion will be characterized by the first normal stress difference
$\unicode[STIX]{x1D70E}^{excess}=\unicode[STIX]{x1D70E}^{int}+\unicode[STIX]{x1D70E}^{ptb}$
due to the presence of drops. After computing them, the steady shear rheology of the emulsion will be characterized by the first normal stress difference
![]() $N_{1}$
, the second normal stress difference
$N_{1}$
, the second normal stress difference
![]() $N_{2}$
and the effective viscosity
$N_{2}$
and the effective viscosity
![]() $\unicode[STIX]{x1D707}_{e}$
:
$\unicode[STIX]{x1D707}_{e}$
:
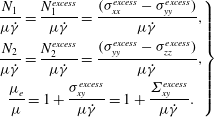 $$\begin{eqnarray}\left.\begin{array}{@{}c@{}}\displaystyle \frac{N_{1}}{\unicode[STIX]{x1D707}\dot{\unicode[STIX]{x1D6FE}}}=\frac{N_{1}^{excess}}{\unicode[STIX]{x1D707}\dot{\unicode[STIX]{x1D6FE}}}=\frac{(\unicode[STIX]{x1D70E}_{xx}^{excess}-\unicode[STIX]{x1D70E}_{yy}^{excess})}{\unicode[STIX]{x1D707}\dot{\unicode[STIX]{x1D6FE}}},\\ \displaystyle \frac{N_{2}}{\unicode[STIX]{x1D707}\dot{\unicode[STIX]{x1D6FE}}}=\frac{N_{2}^{excess}}{\unicode[STIX]{x1D707}\dot{\unicode[STIX]{x1D6FE}}}=\frac{(\unicode[STIX]{x1D70E}_{yy}^{excess}-\unicode[STIX]{x1D70E}_{zz}^{excess})}{\unicode[STIX]{x1D707}\dot{\unicode[STIX]{x1D6FE}}},\\ \displaystyle \frac{\unicode[STIX]{x1D707}_{e}}{\unicode[STIX]{x1D707}}=1+\frac{\unicode[STIX]{x1D70E}_{xy}^{excess}}{\unicode[STIX]{x1D707}\dot{\unicode[STIX]{x1D6FE}}}=1+\frac{\unicode[STIX]{x1D6F4}_{xy}^{excess}}{\unicode[STIX]{x1D707}\dot{\unicode[STIX]{x1D6FE}}}.\end{array}\right\}\end{eqnarray}$$
We use the symbol
![]() $\unicode[STIX]{x1D6F4}_{xy}$
for the excess shear stress, which is more common in the literature and was also used in our previous work (Li & Sarkar Reference Li and Sarkar2005b
).
$\unicode[STIX]{x1D6F4}_{xy}$
for the excess shear stress, which is more common in the literature and was also used in our previous work (Li & Sarkar Reference Li and Sarkar2005b
).
3 Results and discussion
3.1 Dilute emulsion limit: comparison with the Choi–Schowalter model
We first consider a dilute emulsion with a volume fraction of
![]() $\unicode[STIX]{x1D719}=0.0025$
and compare the results with the Choi–Schowalter model (Choi & Schowalter Reference Choi and Schowalter1975). The Choi–Schowalter model assumes Stokes flow; our simulations are performed at a small but non-zero value of the Reynolds number,
$\unicode[STIX]{x1D719}=0.0025$
and compare the results with the Choi–Schowalter model (Choi & Schowalter Reference Choi and Schowalter1975). The Choi–Schowalter model assumes Stokes flow; our simulations are performed at a small but non-zero value of the Reynolds number,
![]() $Re=0.1$
. The simulations are performed with four drops initially positioned at random locations in a domain of size
$Re=0.1$
. The simulations are performed with four drops initially positioned at random locations in a domain of size
![]() $15\times 30\times 15$
(normalized by the initial drop radius
$15\times 30\times 15$
(normalized by the initial drop radius
![]() $a$
) with a grid resolution of
$a$
) with a grid resolution of
![]() $128\times 256\times 128$
. This size is chosen to be sufficiently large (the effects of domain size on the results are examined in the next section). In figure 2, we plot the normal stress differences, the shear stress being plotted in the inset. The stresses have been scaled by
$128\times 256\times 128$
. This size is chosen to be sufficiently large (the effects of domain size on the results are examined in the next section). In figure 2, we plot the normal stress differences, the shear stress being plotted in the inset. The stresses have been scaled by
![]() $\unicode[STIX]{x1D707}\dot{\unicode[STIX]{x1D6FE}}\unicode[STIX]{x1D719}$
. The results are identical to what was observed in our previous dilute emulsion study using single drops (Li & Sarkar Reference Li and Sarkar2005b
) – the normal stress differences match very well with the Choi–Schowalter model while the shear stress matches well at low capillary numbers. The deviation between the model and the simulation at higher
$\unicode[STIX]{x1D707}\dot{\unicode[STIX]{x1D6FE}}\unicode[STIX]{x1D719}$
. The results are identical to what was observed in our previous dilute emulsion study using single drops (Li & Sarkar Reference Li and Sarkar2005b
) – the normal stress differences match very well with the Choi–Schowalter model while the shear stress matches well at low capillary numbers. The deviation between the model and the simulation at higher
![]() $Ca$
can be expected as the model is valid only for small deformation.
$Ca$
can be expected as the model is valid only for small deformation.
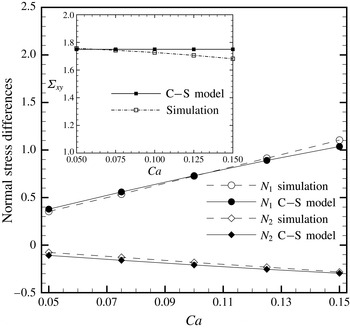
Figure 2. Comparison of the simulated effective stresses
![]() $N_{1},N_{2}$
and
$N_{1},N_{2}$
and
![]() $\unicode[STIX]{x1D6F4}_{xy}$
(inset) with the Choi–Schowalter model at
$\unicode[STIX]{x1D6F4}_{xy}$
(inset) with the Choi–Schowalter model at
![]() $\unicode[STIX]{x1D719}=0.25\,\%$
,
$\unicode[STIX]{x1D719}=0.25\,\%$
,
![]() $Re=0.1$
. The stresses are scaled by
$Re=0.1$
. The stresses are scaled by
![]() $\unicode[STIX]{x1D707}\dot{\unicode[STIX]{x1D6FE}}\unicode[STIX]{x1D719}$
.
$\unicode[STIX]{x1D707}\dot{\unicode[STIX]{x1D6FE}}\unicode[STIX]{x1D719}$
.
3.2 Concentrated emulsion: numerical validation
In this paper, we investigate the rheology of an emulsion with varying capillary and Reynolds numbers in the volume fraction range of 5 %–27 %. The simulation involves a number of numerical parameters, e.g. the size of the domain (i.e. the averaging volume) relative to the drop size, the number of drops and the mesh resolution. In this section, we report on the sensitivity of the results to these parameters. It should be noted that the individual stresses, specifically the interfacial stresses arising from the drop shapes, fluctuate over time
![]() $t^{\prime }(=\dot{\unicode[STIX]{x1D6FE}}t)$
due to drop–drop interactions as drops come into close proximity to each other and separate (figure 3
a–c). The rheological stresses discussed hereafter are obtained using time averaging after discarding an initial transient part of the simulation. The remaining portion of the simulation is subdivided into smaller time intervals (30 inverse shear units) and the average of each time interval is computed. These time interval averages are approximately uncorrelated (Zinchenko & Davis Reference Zinchenko and Davis2002). The mean of these averages is reported as the time averaged data (under the assumption of ergodicity, it is equal also to an ensemble average). The corresponding standard deviation of the averages of different time intervals is reported as the error below. The averages are obtained over a time evolution of at least 170 inverse shear units.
$t^{\prime }(=\dot{\unicode[STIX]{x1D6FE}}t)$
due to drop–drop interactions as drops come into close proximity to each other and separate (figure 3
a–c). The rheological stresses discussed hereafter are obtained using time averaging after discarding an initial transient part of the simulation. The remaining portion of the simulation is subdivided into smaller time intervals (30 inverse shear units) and the average of each time interval is computed. These time interval averages are approximately uncorrelated (Zinchenko & Davis Reference Zinchenko and Davis2002). The mean of these averages is reported as the time averaged data (under the assumption of ergodicity, it is equal also to an ensemble average). The corresponding standard deviation of the averages of different time intervals is reported as the error below. The averages are obtained over a time evolution of at least 170 inverse shear units.
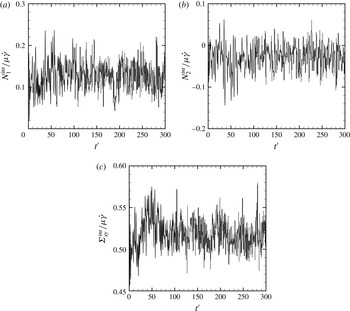
Figure 3. The time evolution of the effective interfacial stresses (a)
![]() $N_{1}$
, (b)
$N_{1}$
, (b)
![]() $N_{2}$
and (c)
$N_{2}$
and (c)
![]() $\unicode[STIX]{x1D6F4}_{xy}$
(
$\unicode[STIX]{x1D6F4}_{xy}$
(
![]() $\unicode[STIX]{x1D719}=0.20$
,
$\unicode[STIX]{x1D719}=0.20$
,
![]() $Re=1.0$
and
$Re=1.0$
and
![]() $Ca=0.05$
, simulated using 64 drops and a
$Ca=0.05$
, simulated using 64 drops and a
![]() $128\times 128\times 128$
grid in an
$128\times 128\times 128$
grid in an
![]() $L\times L\times L$
domain).
$L\times L\times L$
domain).
3.2.1 Grid resolution
We use an adaptive front surface regridding that controls front mesh distortion and the ratio of the front element length to the Eulerian grid spacing. The number of grid points in the Eulerian mesh therefore controls the overall grid resolution, specifically the ability of the mesh to resolve the surface tension force arising from the curvature of the drop interface. Figure 4(a,b) shows the effects of four different grids, namely
![]() $64\times 64\times 64,98\times 98\times 98$
,
$64\times 64\times 64,98\times 98\times 98$
,
![]() $128\times 128\times 128$
and
$128\times 128\times 128$
and
![]() $192\times 192\times 192$
(for an
$192\times 192\times 192$
(for an
![]() $L\times L\times L$
domain), on the time variations of the first normal stress difference and the shear stress at
$L\times L\times L$
domain), on the time variations of the first normal stress difference and the shear stress at
![]() $Ca=0.05$
,
$Ca=0.05$
,
![]() $Re=1.0$
and two different volume fractions,
$Re=1.0$
and two different volume fractions,
![]() $\unicode[STIX]{x1D719}=5\,\%$
(
$\unicode[STIX]{x1D719}=5\,\%$
(
![]() $L/a\sim 17$
) and
$L/a\sim 17$
) and
![]() $\unicode[STIX]{x1D719}=20\,\%\,(L/a\sim 11)$
. The number of drops is
$\unicode[STIX]{x1D719}=20\,\%\,(L/a\sim 11)$
. The number of drops is
![]() $N=64$
. The results are plotted only for the first 10 time units, to avoid the clutter that would have resulted from the entire time range. However, the average values (time averages) are reported in the tables below. The simulations are averaged over at least 170 inverse shear units.
$N=64$
. The results are plotted only for the first 10 time units, to avoid the clutter that would have resulted from the entire time range. However, the average values (time averages) are reported in the tables below. The simulations are averaged over at least 170 inverse shear units.
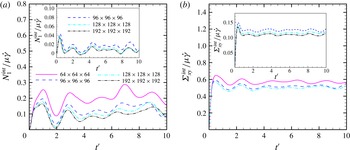
Figure 4. Variation of
![]() $N_{1}^{int}$
(a) and
$N_{1}^{int}$
(a) and
![]() $\unicode[STIX]{x1D6F4}_{xy}^{int}$
(b) with grid resolution for
$\unicode[STIX]{x1D6F4}_{xy}^{int}$
(b) with grid resolution for
![]() $\unicode[STIX]{x1D719}=0.20$
at
$\unicode[STIX]{x1D719}=0.20$
at
![]() $Ca=0.05$
and
$Ca=0.05$
and
![]() $Re=1.0$
(the insets plot the same for
$Re=1.0$
(the insets plot the same for
![]() $\unicode[STIX]{x1D719}=0.05$
).
$\unicode[STIX]{x1D719}=0.05$
).
Table 1. Grid resolution test at
![]() $\unicode[STIX]{x1D719}=20\,\%$
,
$\unicode[STIX]{x1D719}=20\,\%$
,
![]() $Re=1.0$
and
$Re=1.0$
and
![]() $Ca=0.05$
.
$Ca=0.05$
.

Table 2. Grid resolution test at
![]() $\unicode[STIX]{x1D719}=20\,\%$
,
$\unicode[STIX]{x1D719}=20\,\%$
,
![]() $Re=1.0$
and
$Re=1.0$
and
![]() $Ca=0.20$
.
$Ca=0.20$
.
The data in tables 1–3 are computed by the method outlined before. Table 1 shows that the normal stress differences have sensitivity (the first normal stress the greatest) to the grid resolution while the shear stresses and deformations are relatively robust with less than 1 % deviation at the maximum grid resolution of
![]() $192\times 192\times 192$
from the smaller one of
$192\times 192\times 192$
from the smaller one of
![]() $128\times 128\times 128$
. However, it should be noted that at this small value of the capillary number,
$128\times 128\times 128$
. However, it should be noted that at this small value of the capillary number,
![]() $Ca=0.05$
, the deformation is small and therefore normal stresses are difficult to capture accurately. Table 2 shows that for
$Ca=0.05$
, the deformation is small and therefore normal stresses are difficult to capture accurately. Table 2 shows that for
![]() $Ca=0.2$
the normal stresses have much less sensitivity (less than 5 %) to grid variation. On the other hand, for the smaller volume fraction
$Ca=0.2$
the normal stresses have much less sensitivity (less than 5 %) to grid variation. On the other hand, for the smaller volume fraction
![]() $\unicode[STIX]{x1D719}=5\,\%$
the drop sizes are smaller and therefore harder to accurately resolve, leading to some variation with grid size, as can be seen in table 3. However, we are more interested in higher concentrations (we investigate the
$\unicode[STIX]{x1D719}=5\,\%$
the drop sizes are smaller and therefore harder to accurately resolve, leading to some variation with grid size, as can be seen in table 3. However, we are more interested in higher concentrations (we investigate the
![]() $\unicode[STIX]{x1D719}=5\,\%$
case separately below). From the results presented in figure 4 and tables 1–3, we conclude that a grid size of
$\unicode[STIX]{x1D719}=5\,\%$
case separately below). From the results presented in figure 4 and tables 1–3, we conclude that a grid size of
![]() $128\times 128\times 128$
is sufficient for this study in the interest of maintaining a reasonable simulation time. The ranges of volume fraction and capillary number considered here are representative of the ranges that are used throughout the paper. Therefore, all simulations use this grid size (except at
$128\times 128\times 128$
is sufficient for this study in the interest of maintaining a reasonable simulation time. The ranges of volume fraction and capillary number considered here are representative of the ranges that are used throughout the paper. Therefore, all simulations use this grid size (except at
![]() $\unicode[STIX]{x1D719}=5\,\%$
).
$\unicode[STIX]{x1D719}=5\,\%$
).
Table 3. Grid resolution study at
![]() $\unicode[STIX]{x1D719}=5\,\%$
,
$\unicode[STIX]{x1D719}=5\,\%$
,
![]() $Re=1.0$
and
$Re=1.0$
and
![]() $Ca=0.05$
.
$Ca=0.05$
.

3.2.2 Dependence on drop number variation and domain size
Zinchenko & Davis (Reference Zinchenko and Davis2002) studied how the number of drops used for rheology calculation can be a source of both systematic and statistical errors. The statistical errors arise due to finite time averaging and can be decreased by averaging over longer time units so that a sufficient number of non-correlated drop interactions is captured. However, the systematic errors may persist due to finite domain size (periodic boundary conditions). They are further exacerbated due to the presence of the walls of the computational domain: a wall gives rise to wall induced migration of drops away from the wall (Chan & Leal Reference Chan and Leal1981; Smart & Leighton Reference Smart and Leighton1991; Mukherjee & Sarkar Reference Mukherjee and Sarkar2013, Reference Mukherjee and Sarkar2014; Singh et al. Reference Singh, Li and Sarkar2014). Confinement by the two walls can also enhance the deformation and stabilize them, when they would otherwise break (Sibillo et al. Reference Sibillo, Pasquariello, Simeone, Cristini and Guido2006). The particular study by Sibillo et al., however, focused on the case where the drop radius was comparable to the domain size, which can change the overall rheology. It should be noted that our aim here is the rheology in free shear. When sufficiently large numbers of drops are considered, the rheological properties should show little variation with further increase in drop number. Moreover, a large drop number ensures that their size relative to the wall separation remains small, minimizing the wall effects.
Table 4 shows the dependence of the interfacial and Reynolds stresses on the number of drops for a low capillary number of 0.05 and a Reynolds number of 1.0. This table shows that
![]() $N=16$
predicts a significantly higher
$N=16$
predicts a significantly higher
![]() $N_{1}$
and lower
$N_{1}$
and lower
![]() $\unicode[STIX]{x1D6F4}_{xy}$
than those at higher
$\unicode[STIX]{x1D6F4}_{xy}$
than those at higher
![]() $N$
. The average values of the stresses converge as the drop number is increased beyond 32 (
$N$
. The average values of the stresses converge as the drop number is increased beyond 32 (
![]() ${\sim}5\,\%$
). The value of
${\sim}5\,\%$
). The value of
![]() $L/a$
(i.e. wall separation to drop radius) is
$L/a$
(i.e. wall separation to drop radius) is
![]() ${\sim}7$
–13 for the number of drops in the range
${\sim}7$
–13 for the number of drops in the range
![]() $N\sim 16$
–100. Table 4 suggests that
$N\sim 16$
–100. Table 4 suggests that
![]() $N=64$
is sufficient. It results in
$N=64$
is sufficient. It results in
![]() $L/a=11$
.
$L/a=11$
.
Table 4. Effects of number of drops at
![]() $\unicode[STIX]{x1D719}=20\,\%$
,
$\unicode[STIX]{x1D719}=20\,\%$
,
![]() $Re=1.0$
and
$Re=1.0$
and
![]() $Ca=0.05$
.
$Ca=0.05$
.

Fixing the number of drops at
![]() $N=64$
, but doubling the wall separation in the
$N=64$
, but doubling the wall separation in the
![]() $y$
direction, gives rise to a domain
$y$
direction, gives rise to a domain
![]() $L\times 2L\times L$
(
$L\times 2L\times L$
(
![]() $L/a=9$
) for the same volume fraction. Table 5 shows that doubling
$L/a=9$
) for the same volume fraction. Table 5 shows that doubling
![]() $L_{y}$
causes very little change in
$L_{y}$
causes very little change in
![]() $\unicode[STIX]{x1D6F4}_{xy}$
. The value of
$\unicode[STIX]{x1D6F4}_{xy}$
. The value of
![]() $N_{2}$
changes substantially, but then its value itself is quite small. We therefore use
$N_{2}$
changes substantially, but then its value itself is quite small. We therefore use
![]() $N=64$
with the cubic domain with
$N=64$
with the cubic domain with
![]() $L/a=11$
which we feel is adequate for the current purpose. Tables 6 and 7 show the effects of an increasing number of drops for different combinations of Reynolds and capillary numbers to further justify the choice
$L/a=11$
which we feel is adequate for the current purpose. Tables 6 and 7 show the effects of an increasing number of drops for different combinations of Reynolds and capillary numbers to further justify the choice
![]() $N=64$
.
$N=64$
.
Table 5. Effects of domain size at
![]() $\unicode[STIX]{x1D719}=20\,\%$
,
$\unicode[STIX]{x1D719}=20\,\%$
,
![]() $Re=1.0$
and
$Re=1.0$
and
![]() $Ca=0.05$
.
$Ca=0.05$
.

Table 6. Effects of number of drops at
![]() $\unicode[STIX]{x1D719}=20\,\%$
,
$\unicode[STIX]{x1D719}=20\,\%$
,
![]() $Re=1.0$
and
$Re=1.0$
and
![]() $Ca=0.20$
.
$Ca=0.20$
.
Table 7. Drop number study for
![]() $\unicode[STIX]{x1D719}=20\,\%$
,
$\unicode[STIX]{x1D719}=20\,\%$
,
![]() $Re=5.0$
and
$Re=5.0$
and
![]() $Ca=0.05$
(average values only).
$Ca=0.05$
(average values only).
Finally, we revisit the variation in the result with increasing grid size for the
![]() $\unicode[STIX]{x1D719}=5\,\%$
case seen in table 3 due to the relatively small drop size and therefore poor resolution at this small concentration. It should be noted that at such a small concentration, drops are sparsely populated and therefore a smaller number of drops in a fixed size domain (correspondingly higher resolution per drop) would be sufficient to describe the dynamics. The first three rows of table 8 show that an increase in drop number with a corresponding increase in grid points does not have a significant effect above
$\unicode[STIX]{x1D719}=5\,\%$
case seen in table 3 due to the relatively small drop size and therefore poor resolution at this small concentration. It should be noted that at such a small concentration, drops are sparsely populated and therefore a smaller number of drops in a fixed size domain (correspondingly higher resolution per drop) would be sufficient to describe the dynamics. The first three rows of table 8 show that an increase in drop number with a corresponding increase in grid points does not have a significant effect above
![]() $N=5$
for this case. The last three rows show that increase of the grid points beyond
$N=5$
for this case. The last three rows show that increase of the grid points beyond
![]() $128\times 128\times 128$
while keeping the drop number fixed at
$128\times 128\times 128$
while keeping the drop number fixed at
![]() $N=5$
also leads to little variation. We therefore use
$N=5$
also leads to little variation. We therefore use
![]() $N=5$
and
$N=5$
and
![]() $128\times 128\times 128$
in all simulations for
$128\times 128\times 128$
in all simulations for
![]() $\unicode[STIX]{x1D719}=5\,\%$
below.
$\unicode[STIX]{x1D719}=5\,\%$
below.
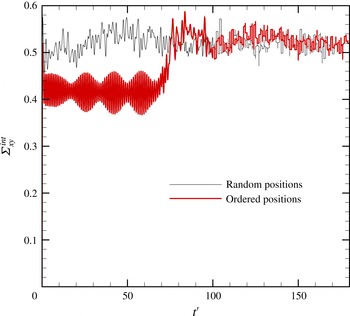
Figure 5. Effect of different initial positions on the development of shear stress (
![]() $\unicode[STIX]{x1D719}=0.20$
,
$\unicode[STIX]{x1D719}=0.20$
,
![]() $Re=1.0$
and
$Re=1.0$
and
![]() $Ca=0.05$
).
$Ca=0.05$
).
Table 8. Grid resolution and drop number for
![]() $\unicode[STIX]{x1D719}=5\,\%$
,
$\unicode[STIX]{x1D719}=5\,\%$
,
![]() $Re=1.0$
and
$Re=1.0$
and
![]() $Ca=0.05$
(average values only).
$Ca=0.05$
(average values only).
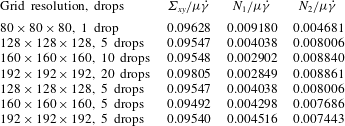
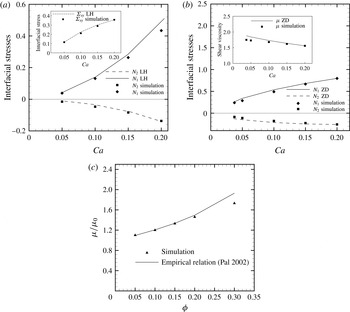
Figure 6. Comparisons of simulated
![]() $N_{1},N_{2}$
and
$N_{1},N_{2}$
and
![]() $\unicode[STIX]{x1D6F4}_{xy}$
(inset) with BEM simulations of Loewenberg & Hinch (Reference Loewenberg and Hinch1996) (LH) at
$\unicode[STIX]{x1D6F4}_{xy}$
(inset) with BEM simulations of Loewenberg & Hinch (Reference Loewenberg and Hinch1996) (LH) at
![]() $\unicode[STIX]{x1D719}=20\,\%$
(a) and Zinchenko & Davis (Reference Zinchenko and Davis2002) (ZD) at
$\unicode[STIX]{x1D719}=20\,\%$
(a) and Zinchenko & Davis (Reference Zinchenko and Davis2002) (ZD) at
![]() $\unicode[STIX]{x1D719}=30\,\%$
(b). Stresses are non-dimenzionalized by
$\unicode[STIX]{x1D719}=30\,\%$
(b). Stresses are non-dimenzionalized by
![]() $\unicode[STIX]{x1D719}\unicode[STIX]{x1D6E4}/a$
in (a) and
$\unicode[STIX]{x1D719}\unicode[STIX]{x1D6E4}/a$
in (a) and
![]() $\unicode[STIX]{x1D707}\dot{\unicode[STIX]{x1D6FE}}$
in (b). (c) Comparison of the viscosity versus volume fraction variation as predicted from simulation and empirical relations. Here,
$\unicode[STIX]{x1D707}\dot{\unicode[STIX]{x1D6FE}}$
in (b). (c) Comparison of the viscosity versus volume fraction variation as predicted from simulation and empirical relations. Here,
![]() $Re=0.10,Ca=0.05$
.
$Re=0.10,Ca=0.05$
.
3.2.3 Dependence on initial position variation
The rheology should be independent of the initial positions of the drops. This was investigated by fixing the volume fraction, Reynolds number and capillary number while varying the initial positions. Figure 5 compares the time evolution of the shear stress for two cases at
![]() $\unicode[STIX]{x1D719}=20\,\%$
,
$\unicode[STIX]{x1D719}=20\,\%$
,
![]() $Ca=0.05$
and
$Ca=0.05$
and
![]() $Re=1.0$
. The first case corresponds to an initially ordered positioning of the drops and the second case corresponds to an initial random positioning. It is clear that the ordered system takes longer to break the initial structure. During the initial 70 time units, the drops move in layers (which is how they are initially distributed) for the ordered case. The shear stress is considerably low since the drop–drop interactions are minimal. After the structure breaks, interdrop interactions result in shear stresses close to those obtained from the second case. This illustrates two points. First of all, the stresses are independent of the initial configuration, as they should be. Second, for the simulation purposes, the initial positioning of the drops should be random to get good time averaged quantities in a reasonable number of cycles. For all simulations the drops are initially randomly positioned.
$Re=1.0$
. The first case corresponds to an initially ordered positioning of the drops and the second case corresponds to an initial random positioning. It is clear that the ordered system takes longer to break the initial structure. During the initial 70 time units, the drops move in layers (which is how they are initially distributed) for the ordered case. The shear stress is considerably low since the drop–drop interactions are minimal. After the structure breaks, interdrop interactions result in shear stresses close to those obtained from the second case. This illustrates two points. First of all, the stresses are independent of the initial configuration, as they should be. Second, for the simulation purposes, the initial positioning of the drops should be random to get good time averaged quantities in a reasonable number of cycles. For all simulations the drops are initially randomly positioned.
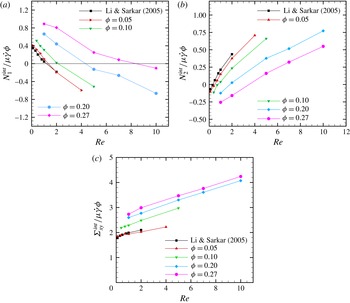
Figure 7. Variation of
![]() $N_{1}^{int}$
(a),
$N_{1}^{int}$
(a),
![]() $N_{2}^{int}$
(b) and
$N_{2}^{int}$
(b) and
![]() $\unicode[STIX]{x1D6F4}_{xy}^{int}$
(c) as functions of
$\unicode[STIX]{x1D6F4}_{xy}^{int}$
(c) as functions of
![]() $Re$
, all at
$Re$
, all at
![]() $Ca=0.05$
.
$Ca=0.05$
.
3.3 Comparison with previous results of concentrated emulsion rheology
We compare our results (simulated at
![]() $Re=0.1$
to approximate Stokes flow) with those obtained using the BEM in the literature (Loewenberg & Hinch Reference Loewenberg and Hinch1996; Zinchenko & Davis Reference Zinchenko and Davis2002) in figure 6(a,b). These two BEM results were for volume fractions of
$Re=0.1$
to approximate Stokes flow) with those obtained using the BEM in the literature (Loewenberg & Hinch Reference Loewenberg and Hinch1996; Zinchenko & Davis Reference Zinchenko and Davis2002) in figure 6(a,b). These two BEM results were for volume fractions of
![]() $\unicode[STIX]{x1D719}=20\,\%$
and
$\unicode[STIX]{x1D719}=20\,\%$
and
![]() $\unicode[STIX]{x1D719}=30\,\%$
. It should be noted that to facilitate comparison, stresses have been scaled by
$\unicode[STIX]{x1D719}=30\,\%$
. It should be noted that to facilitate comparison, stresses have been scaled by
![]() $\unicode[STIX]{x1D719}\unicode[STIX]{x1D6E4}/a$
in figure 6(a) and by
$\unicode[STIX]{x1D719}\unicode[STIX]{x1D6E4}/a$
in figure 6(a) and by
![]() $\unicode[STIX]{x1D707}\dot{\unicode[STIX]{x1D6FE}}$
in figure 6(b). Our simulations match very well with the BEM except for at the low values of Ca in figure 6(b). It is interesting to note the difference – albeit slight (less than 4 %) – between our result and that of Zinchenko & Davis (Reference Zinchenko and Davis2002) for lower Ca values given that the two match very well at
$\unicode[STIX]{x1D707}\dot{\unicode[STIX]{x1D6FE}}$
in figure 6(b). Our simulations match very well with the BEM except for at the low values of Ca in figure 6(b). It is interesting to note the difference – albeit slight (less than 4 %) – between our result and that of Zinchenko & Davis (Reference Zinchenko and Davis2002) for lower Ca values given that the two match very well at
![]() $Ca=0.15$
and 0.2. At low capillary numbers (large value of surface tension), the drop deformation is small. Therefore, small deviations give rise to large variations in the purely geometric interfacial stress tensor that determines the interfacial stresses. The same authors (Zinchenko & Davis Reference Zinchenko and Davis2015) also noted the computational challenges of the system at small capillary numbers. Simulations performed in a larger domain and with an increased number of drops (128 drops in an
$Ca=0.15$
and 0.2. At low capillary numbers (large value of surface tension), the drop deformation is small. Therefore, small deviations give rise to large variations in the purely geometric interfacial stress tensor that determines the interfacial stresses. The same authors (Zinchenko & Davis Reference Zinchenko and Davis2015) also noted the computational challenges of the system at small capillary numbers. Simulations performed in a larger domain and with an increased number of drops (128 drops in an
![]() $L\times 2L\times L$
domain with
$L\times 2L\times L$
domain with
![]() $128\times 256\times 128$
) slightly improved the match with the BEM result at the lower capillary numbers. Figure 6(c) shows a comparison of the viscosity variation with volume fraction predicted by the simulation with the empirical relations obtained by Pal (Reference Pal2003). Pal derived three empirical models and tested them against a range of experiments. The third model in that paper was shown to give the best match with experiments. Figure 6(c) shows that the comparison with that empirical model is quite good.
$128\times 256\times 128$
) slightly improved the match with the BEM result at the lower capillary numbers. Figure 6(c) shows a comparison of the viscosity variation with volume fraction predicted by the simulation with the empirical relations obtained by Pal (Reference Pal2003). Pal derived three empirical models and tested them against a range of experiments. The third model in that paper was shown to give the best match with experiments. Figure 6(c) shows that the comparison with that empirical model is quite good.
3.4 Interfacial stresses $\unicode[STIX]{x1D748}^{int}$
: effects of Re and volume fraction
It should be noted that according to (2.3), the effective stresses for the viscosity-matched system have two contributions
![]() $\unicode[STIX]{x1D748}^{int}$
and
$\unicode[STIX]{x1D748}^{int}$
and
![]() $\unicode[STIX]{x1D748}^{ptb}$
. The second component arises as a direct effect of finite inertia and increases with increasing Reynolds number. We found earlier (Li & Sarkar Reference Li and Sarkar2005b
) that
$\unicode[STIX]{x1D748}^{ptb}$
. The second component arises as a direct effect of finite inertia and increases with increasing Reynolds number. We found earlier (Li & Sarkar Reference Li and Sarkar2005b
) that
![]() $\unicode[STIX]{x1D748}^{int}$
is much larger in magnitude than
$\unicode[STIX]{x1D748}^{int}$
is much larger in magnitude than
![]() $\unicode[STIX]{x1D748}^{ptb}$
in the dilute emulsion limit for low Reynolds numbers (
$\unicode[STIX]{x1D748}^{ptb}$
in the dilute emulsion limit for low Reynolds numbers (
![]() $Re\leqslant 1$
). Figure 7(a–c) shows the dependence of the interfacial stresses
$Re\leqslant 1$
). Figure 7(a–c) shows the dependence of the interfacial stresses
![]() $\unicode[STIX]{x1D748}^{int}$
on the Reynolds number for four different volume fractions. The plots also include the dilute emulsion results of Li & Sarkar (Reference Li and Sarkar2005b
) where the sign reversal of the normal stress differences with Reynolds number was first noticed. The stresses have been scaled by
$\unicode[STIX]{x1D748}^{int}$
on the Reynolds number for four different volume fractions. The plots also include the dilute emulsion results of Li & Sarkar (Reference Li and Sarkar2005b
) where the sign reversal of the normal stress differences with Reynolds number was first noticed. The stresses have been scaled by
![]() $\unicode[STIX]{x1D719}$
to allow comparison between different volume fractions. The capillary number is fixed at 0.05. These plots show that
$\unicode[STIX]{x1D719}$
to allow comparison between different volume fractions. The capillary number is fixed at 0.05. These plots show that
![]() $N_{1}^{int}$
decreases while
$N_{1}^{int}$
decreases while
![]() $N_{2}^{int}$
increases with Reynolds number in the entire range of volume fractions considered here, leading eventually to reversal of their signs (Li & Sarkar Reference Li and Sarkar2005b
). It should be noted that although scaled by
$N_{2}^{int}$
increases with Reynolds number in the entire range of volume fractions considered here, leading eventually to reversal of their signs (Li & Sarkar Reference Li and Sarkar2005b
). It should be noted that although scaled by
![]() $\unicode[STIX]{x1D719}$
, the curves for different volume fractions do not collapse onto a single curve, indicating nonlinear dependence on
$\unicode[STIX]{x1D719}$
, the curves for different volume fractions do not collapse onto a single curve, indicating nonlinear dependence on
![]() $\unicode[STIX]{x1D719}$
of the interparticle interactions – pair, triple and higher-order interactions (Zhou & Pozrikidis Reference Zhou and Pozrikidis1993). Increasing volume fraction delays the reversal of signs of the interfacial normal stress differences. The interfacial shear stress increases with Reynolds number over the volume fraction range considered.
$\unicode[STIX]{x1D719}$
of the interparticle interactions – pair, triple and higher-order interactions (Zhou & Pozrikidis Reference Zhou and Pozrikidis1993). Increasing volume fraction delays the reversal of signs of the interfacial normal stress differences. The interfacial shear stress increases with Reynolds number over the volume fraction range considered.
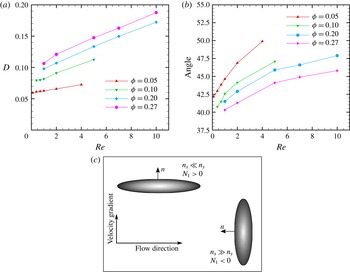
Figure 8. Variation of drop inclination (a) and deformation (b) as functions of
![]() $Re$
, both at
$Re$
, both at
![]() $Ca=0.05$
. (c) Sketch of drop orientations.
$Ca=0.05$
. (c) Sketch of drop orientations.
The above observations can be explained by considering the average drop orientation and deformation. As noted before,
![]() $\unicode[STIX]{x1D748}^{int}$
is determined by the geometry of the drop (see (2.3)). Previously, we demonstrated that the sign reversal of the first normal stress difference occurs due to the drop inclination becoming greater than
$\unicode[STIX]{x1D748}^{int}$
is determined by the geometry of the drop (see (2.3)). Previously, we demonstrated that the sign reversal of the first normal stress difference occurs due to the drop inclination becoming greater than
![]() $45^{\circ }$
with increasing inertia (Li & Sarkar Reference Li and Sarkar2005b
; Singh & Sarkar Reference Singh and Sarkar2011). Here, we provide a simple physical explanation of the phenomenon. We plot the average drop deformation and angle of inclination as functions of
$45^{\circ }$
with increasing inertia (Li & Sarkar Reference Li and Sarkar2005b
; Singh & Sarkar Reference Singh and Sarkar2011). Here, we provide a simple physical explanation of the phenomenon. We plot the average drop deformation and angle of inclination as functions of
![]() $Re$
for various volume fractions in figure 8(a,b). The average deformation increases with increasing volume fraction while the inclination decreases. It should be noted that the normal stress differences consist of an additive contribution from each drop of the
$Re$
for various volume fractions in figure 8(a,b). The average deformation increases with increasing volume fraction while the inclination decreases. It should be noted that the normal stress differences consist of an additive contribution from each drop of the
![]() $N$
drops present:
$N$
drops present:
 $$\begin{eqnarray}\left.\begin{array}{@{}c@{}}\displaystyle N_{1}^{int}=\unicode[STIX]{x1D70E}_{xx}^{int}-\unicode[STIX]{x1D70E}_{yy}^{int}\sim -N\int _{\unicode[STIX]{x1D6FF}A}(n_{x}^{2}-n_{y}^{2})\,\text{d}A,\\ \displaystyle N_{2}^{int}=\unicode[STIX]{x1D70E}_{yy}^{int}-\unicode[STIX]{x1D70E}_{zz}^{int}\sim -N\int _{\unicode[STIX]{x1D6FF}A}(n_{y}^{2}-n_{z}^{2})\,\text{d}A.\end{array}\right\}\end{eqnarray}$$
Figure 8(c) shows two extreme orientations of a drop relative to the flow direction. If the drop is aligned along the flow
![]() $(x)$
direction then
$(x)$
direction then
![]() $n_{x}\ll n_{y}$
for most of the surface, leading to
$n_{x}\ll n_{y}$
for most of the surface, leading to
![]() $N_{1}>0$
according to (3.1). On the other hand, if the drop is aligned along the velocity gradient,
$N_{1}>0$
according to (3.1). On the other hand, if the drop is aligned along the velocity gradient,
![]() $N_{1}<0$
. If the drop is aligned along the extensional axis, i.e. with an inclination angle of
$N_{1}<0$
. If the drop is aligned along the extensional axis, i.e. with an inclination angle of
![]() $45^{\circ }$
,
$45^{\circ }$
,
![]() $N_{1}\approx 0$
. An inclination angle in excess of
$N_{1}\approx 0$
. An inclination angle in excess of
![]() $45^{\circ }$
changes the sign. A similar argument can also be given for
$45^{\circ }$
changes the sign. A similar argument can also be given for
![]() $N_{2}$
. Typically, for orientation along the flow direction, dominance of
$N_{2}$
. Typically, for orientation along the flow direction, dominance of
![]() $n_{y}$
gives rise to
$n_{y}$
gives rise to
![]() $N_{2}<0$
. As the drop rotates in its shear plane from the flow direction to the velocity gradient direction,
$N_{2}<0$
. As the drop rotates in its shear plane from the flow direction to the velocity gradient direction,
![]() $n_{y}$
decreases but
$n_{y}$
decreases but
![]() $n_{z}$
remains roughly unchanged. It increases
$n_{z}$
remains roughly unchanged. It increases
![]() $N_{2}$
, eventually making it positive. The total interfacial stress is dictated by drop inclination averaged over all drops. Similar to the case of a single drop in shear (Li & Sarkar Reference Li and Sarkar2005b
), figure 8(b) here shows that the average drop inclination increases with Reynolds number, eventually exceeding
$N_{2}$
, eventually making it positive. The total interfacial stress is dictated by drop inclination averaged over all drops. Similar to the case of a single drop in shear (Li & Sarkar Reference Li and Sarkar2005b
), figure 8(b) here shows that the average drop inclination increases with Reynolds number, eventually exceeding
![]() $45^{\circ }$
, leading to the sign reversal of
$45^{\circ }$
, leading to the sign reversal of
![]() $N_{1}$
. It should also be noted that the average drop inclination decreases with increasing volume fraction because of the aligning influence from flowing drops in the neighbourhood, as was also noted before in Stokes flow (Loewenberg & Hinch Reference Loewenberg and Hinch1996). It delays the sign reversal seen in figure 7(a,b).
$N_{1}$
. It should also be noted that the average drop inclination decreases with increasing volume fraction because of the aligning influence from flowing drops in the neighbourhood, as was also noted before in Stokes flow (Loewenberg & Hinch Reference Loewenberg and Hinch1996). It delays the sign reversal seen in figure 7(a,b).
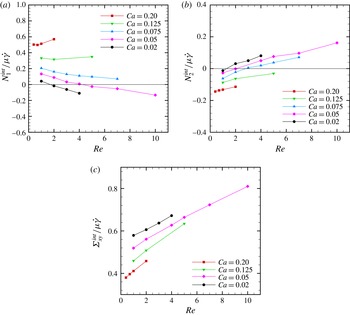
Figure 9. Variation of interfacial stresses with
![]() $Re$
for different
$Re$
for different
![]() $Ca$
: (a)
$Ca$
: (a)
![]() $N_{1}^{int}$
, (b)
$N_{1}^{int}$
, (b)
![]() $N_{2}^{int}$
and (c)
$N_{2}^{int}$
and (c)
![]() $\unicode[STIX]{x1D6F4}_{xy}^{int}$
at
$\unicode[STIX]{x1D6F4}_{xy}^{int}$
at
![]() $\unicode[STIX]{x1D719}=20\,\%$
.
$\unicode[STIX]{x1D719}=20\,\%$
.
Figure 7(c) shows that the effective shear stress increases with Reynolds number at a fixed volume fraction. It also increases with volume fraction at a fixed Reynolds number. Similar to (3.1), the individual contribution from a drop towards the average interfacial shear stress is
However, the cross-term does not render an easy explanation of the increase of shear stress with
![]() $Re$
in terms of the inclination angle. For an ellipsoidal drop, one can compute the geometric integral in terms of an elliptic integral (Almusallam et al.
Reference Almusallam, Larson and Solomon2000). A simpler expression, assuming a drop shape of a capped short cylinder, is provided by Loewenberg & Hinch (Reference Loewenberg and Hinch1996):
$Re$
in terms of the inclination angle. For an ellipsoidal drop, one can compute the geometric integral in terms of an elliptic integral (Almusallam et al.
Reference Almusallam, Larson and Solomon2000). A simpler expression, assuming a drop shape of a capped short cylinder, is provided by Loewenberg & Hinch (Reference Loewenberg and Hinch1996):
Here,
![]() $D$
is the Taylor deformation (
$D$
is the Taylor deformation (
![]() $L$
and
$L$
and
![]() $B$
are the major and minor axes respectively of the deformed drop,
$B$
are the major and minor axes respectively of the deformed drop,
![]() $D=(L-B)/(L+B)$
). This expression shows the combined effects of the deformation and inclination. With increasing inertia, the deformation and inclination increase. The inclination term
$D=(L-B)/(L+B)$
). This expression shows the combined effects of the deformation and inclination. With increasing inertia, the deformation and inclination increase. The inclination term
![]() $\sin 2\unicode[STIX]{x1D703}$
increases or decreases to
$\sin 2\unicode[STIX]{x1D703}$
increases or decreases to
![]() ${\sim}\pm 0.98$
from its maximum value of 1.0 at
${\sim}\pm 0.98$
from its maximum value of 1.0 at
![]() $\unicode[STIX]{x1D703}=45^{\circ }$
when changed by
$\unicode[STIX]{x1D703}=45^{\circ }$
when changed by
![]() $\pm 5^{\circ }$
(figure 8
b). However, figure 8(a) shows that the deformation
$\pm 5^{\circ }$
(figure 8
b). However, figure 8(a) shows that the deformation
![]() $D$
increases twofold over the range of
$D$
increases twofold over the range of
![]() $Re=1$
–10, leading to the observed enhancement in shear stress. Increasing deformation with volume fraction also explains the increasing shear stress with volume fraction.
$Re=1$
–10, leading to the observed enhancement in shear stress. Increasing deformation with volume fraction also explains the increasing shear stress with volume fraction.
3.5 Interfacial stresses $\unicode[STIX]{x1D748}^{int}$
: effects of Re and Ca
For a single drop, we have shown that the inclination angle increases with increasing Reynolds number for smaller capillary numbers; at higher capillary numbers, the increased deformation at higher inertia leads to an eventual decrease of inclination with increasing inertia (Singh & Sarkar Reference Singh and Sarkar2011). The drop inclination changes and thereby the sign reversal could alternately be described by the Ohnesorge number – the ratio between the Reynolds and capillary numbers (Raja et al.
Reference Raja, Subramanian and Koch2010). The sign reversal of normal stress differences appears at a critical Ohnesorge number and the phenomenon is seen in a small range of capillary numbers (Li & Sarkar Reference Li and Sarkar2005b
). We first investigate in figure 9 variations of the interfacial normal stress differences and shear stress with Reynolds number over a range of capillary numbers at a fixed volume fraction of 20 %. Figure 9(a) shows that the sign reversal of
![]() $N_{1}^{int}$
occurs for the lowest two capillary numbers (
$N_{1}^{int}$
occurs for the lowest two capillary numbers (
![]() $Ca=0.02$
and 0.05), and takes place at a lower Reynolds number for the smaller
$Ca=0.02$
and 0.05), and takes place at a lower Reynolds number for the smaller
![]() $Ca$
. For the other Ca values (
$Ca$
. For the other Ca values (
![]() ${>}0.05$
),
${>}0.05$
),
![]() $N_{1}^{int}$
decreases with increasing inertia at least initially but does not become negative. The drop experiences large deformation, leading to eventual breakup beyond
$N_{1}^{int}$
decreases with increasing inertia at least initially but does not become negative. The drop experiences large deformation, leading to eventual breakup beyond
![]() $Re=5$
at
$Re=5$
at
![]() $Ca=0.125$
and
$Ca=0.125$
and
![]() $Re=2$
at
$Re=2$
at
![]() $Ca=0.2$
. Similar variation and sign reversal (delayed at higher
$Ca=0.2$
. Similar variation and sign reversal (delayed at higher
![]() $Ca$
) of
$Ca$
) of
![]() $N_{2}^{int}$
are observed in figure 9(b). With increasing
$N_{2}^{int}$
are observed in figure 9(b). With increasing
![]() $Re$
, the shear stress
$Re$
, the shear stress
![]() $\unicode[STIX]{x1D6F4}_{xy}^{int}$
increases due to increased deformation (figure 9
c). From figures 7(a–c) and 9(a–c) one can see an approximately linear variation of the normal stress differences and the shear stress with
$\unicode[STIX]{x1D6F4}_{xy}^{int}$
increases due to increased deformation (figure 9
c). From figures 7(a–c) and 9(a–c) one can see an approximately linear variation of the normal stress differences and the shear stress with
![]() $Re$
, at least for the lower capillary numbers.
$Re$
, at least for the lower capillary numbers.
Figure 10(a,b) shows the dependence of the interfacial stresses, the deformation and the inclination on the capillary number at fixed Reynolds number (
![]() $Re=1.0$
) and volume fraction
$Re=1.0$
) and volume fraction
![]() $(\unicode[STIX]{x1D719}=20\,\%)$
. With increasing capillary number,
$(\unicode[STIX]{x1D719}=20\,\%)$
. With increasing capillary number,
![]() $N_{1}^{int}$
increases linearly, while
$N_{1}^{int}$
increases linearly, while
![]() $N_{2}^{int}$
and
$N_{2}^{int}$
and
![]() $\unicode[STIX]{x1D6F4}_{xy}^{int}$
linearly decrease. Decreasing shear stress with increasing shear rate – shear thinning – is well known and can be attributed to the precipitous decrease in inclination (figure 10
b inset) and relation (3.3). The increased deformation and the resulting decreased inclination at larger Ca can also be seen in figure 10(c,d). Corresponding effects on the surface normal components
$\unicode[STIX]{x1D6F4}_{xy}^{int}$
linearly decrease. Decreasing shear stress with increasing shear rate – shear thinning – is well known and can be attributed to the precipitous decrease in inclination (figure 10
b inset) and relation (3.3). The increased deformation and the resulting decreased inclination at larger Ca can also be seen in figure 10(c,d). Corresponding effects on the surface normal components
![]() $n_{x}$
and
$n_{x}$
and
![]() $n_{y}$
explain the behaviour of
$n_{y}$
explain the behaviour of
![]() $N_{1}^{int}$
and
$N_{1}^{int}$
and
![]() $N_{2}^{int}$
as per equation (3.1). The shear thinning behaviour and the increase in the first normal stress difference were measured experimentally by Han & King (Reference Han and King1980), and seen in simulation by Loewenberg & Hinch (Reference Loewenberg and Hinch1996). It should also be noted that the fact that the non-dimensional normal stresses
$N_{2}^{int}$
as per equation (3.1). The shear thinning behaviour and the increase in the first normal stress difference were measured experimentally by Han & King (Reference Han and King1980), and seen in simulation by Loewenberg & Hinch (Reference Loewenberg and Hinch1996). It should also be noted that the fact that the non-dimensional normal stresses
![]() $N_{1,2}/\unicode[STIX]{x1D707}\dot{\unicode[STIX]{x1D6FE}}$
are linear with
$N_{1,2}/\unicode[STIX]{x1D707}\dot{\unicode[STIX]{x1D6FE}}$
are linear with
![]() $Ca=\unicode[STIX]{x1D707}\dot{\unicode[STIX]{x1D6FE}}a/\unicode[STIX]{x1D6E4}$
is in agreement with the well-known relation
$Ca=\unicode[STIX]{x1D707}\dot{\unicode[STIX]{x1D6FE}}a/\unicode[STIX]{x1D6E4}$
is in agreement with the well-known relation
![]() $N_{1,2}\propto \dot{\unicode[STIX]{x1D6FE}}^{2}$
for small shear rates. The quadratic variation with shear rate motivates the definition of normal stress coefficients
$N_{1,2}\propto \dot{\unicode[STIX]{x1D6FE}}^{2}$
for small shear rates. The quadratic variation with shear rate motivates the definition of normal stress coefficients
![]() $\unicode[STIX]{x1D6F9}_{1,2}=N_{1,2}/\dot{\unicode[STIX]{x1D6FE}}^{2}$
often used in the literature (Larson Reference Larson1999).
$\unicode[STIX]{x1D6F9}_{1,2}=N_{1,2}/\dot{\unicode[STIX]{x1D6FE}}^{2}$
often used in the literature (Larson Reference Larson1999).
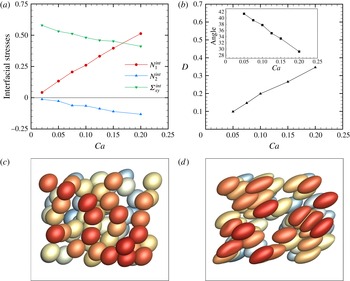
Figure 10. Variation of interfacial stresses non-dimensionalized by
![]() $\unicode[STIX]{x1D707}\dot{\unicode[STIX]{x1D6FE}}$
(a), deformation and inclination angle (b) with
$\unicode[STIX]{x1D707}\dot{\unicode[STIX]{x1D6FE}}$
(a), deformation and inclination angle (b) with
![]() $Ca$
at
$Ca$
at
![]() $Re=1.0$
and
$Re=1.0$
and
![]() $\unicode[STIX]{x1D719}=20\,\%$
. Drop shapes at
$\unicode[STIX]{x1D719}=20\,\%$
. Drop shapes at
![]() $Ca=0.05$
(c) and
$Ca=0.05$
(c) and
![]() $Ca=0.2$
(d), both for
$Ca=0.2$
(d), both for
![]() $Re=1.0$
and
$Re=1.0$
and
![]() $\unicode[STIX]{x1D719}=20\,\%$
.
$\unicode[STIX]{x1D719}=20\,\%$
.
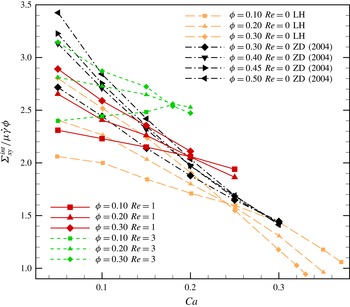
Figure 11. Interfacial viscous stress contribution due to drops as a function of
![]() $Ca$
for different volume fractions and different values of
$Ca$
for different volume fractions and different values of
![]() $Re$
. The ‘cross-over/convergence’ capillary number decreases with increasing
$Re$
. The ‘cross-over/convergence’ capillary number decreases with increasing
![]() $Re$
. Here, LH and ZD (2004) refer to the BEM simulations by Loewenberg & Hinch (Reference Loewenberg and Hinch1996) and Zinchenko & Davis (Reference Zinchenko, Davis and Petsev2004) respectively.
$Re$
. Here, LH and ZD (2004) refer to the BEM simulations by Loewenberg & Hinch (Reference Loewenberg and Hinch1996) and Zinchenko & Davis (Reference Zinchenko, Davis and Petsev2004) respectively.
Loewenberg & Hinch (Reference Loewenberg and Hinch1996) observed that the shear viscosity contribution of drops increases with volume fraction at lower shear rates, remains independent of volume fraction at
![]() $Ca=0.25$
, and decreases with volume fraction at higher shear rates
$Ca=0.25$
, and decreases with volume fraction at higher shear rates
![]() $(Ca>0.25)$
. These authors argued that at lower capillary numbers, the increase in viscosity with volume fraction arises from increasing drop collisions. At higher capillary numbers, drops experience larger deformation; increased interactions at increasing volume fraction align them with the flow (decreased inclination), which in turn leads to decreasing viscosity (with increasing volume fraction). The authors found the viscosity versus Ca curves for different volume fractions to cross over at
$(Ca>0.25)$
. These authors argued that at lower capillary numbers, the increase in viscosity with volume fraction arises from increasing drop collisions. At higher capillary numbers, drops experience larger deformation; increased interactions at increasing volume fraction align them with the flow (decreased inclination), which in turn leads to decreasing viscosity (with increasing volume fraction). The authors found the viscosity versus Ca curves for different volume fractions to cross over at
![]() $Ca=0.25$
. More accurate BEM computations by Zinchenko & Davis (Reference Zinchenko, Davis and Petsev2004) found the convergence of the viscosity versus Ca curves for different volume fractions to occur at a higher Ca value. We investigate how inertia affects this phenomenon, including both results for Stokes flow in figure 11. The capillary number for convergence decreases with Reynolds number. At higher Reynolds numbers, simulation of larger-capillary-number cases could not be continued due to eventual breakup of drops. It should be noted that for
$Ca=0.25$
. More accurate BEM computations by Zinchenko & Davis (Reference Zinchenko, Davis and Petsev2004) found the convergence of the viscosity versus Ca curves for different volume fractions to occur at a higher Ca value. We investigate how inertia affects this phenomenon, including both results for Stokes flow in figure 11. The capillary number for convergence decreases with Reynolds number. At higher Reynolds numbers, simulation of larger-capillary-number cases could not be continued due to eventual breakup of drops. It should be noted that for
![]() $Re=3$
, at the lowest concentration of
$Re=3$
, at the lowest concentration of
![]() $\unicode[STIX]{x1D719}=10\,\%$
, the viscosity contribution increases with capillary number in contrast to all other cases seen here as well as in figure 10. This can be explained by equation (3.3) in view of the increased deformation and enhanced drop inclination at this higher
$\unicode[STIX]{x1D719}=10\,\%$
, the viscosity contribution increases with capillary number in contrast to all other cases seen here as well as in figure 10. This can be explained by equation (3.3) in view of the increased deformation and enhanced drop inclination at this higher
![]() $Re$
value. At higher volume fractions, drop–drop interactions decrease the inclination, reversing this effect. A reversal of trend in shear viscosity with capillary number – decreasing at lower
$Re$
value. At higher volume fractions, drop–drop interactions decrease the inclination, reversing this effect. A reversal of trend in shear viscosity with capillary number – decreasing at lower
![]() $Re$
and increasing at higher Re – was also observed for dilute emulsions (Li & Sarkar Reference Li and Sarkar2005b
).
$Re$
and increasing at higher Re – was also observed for dilute emulsions (Li & Sarkar Reference Li and Sarkar2005b
).
3.6 Drop–drop interactions and pair-distribution function in concentrated emulsions
Thus far, we have explained rheological observations in terms of the individual drop response. With increasing emulsion concentration, drop–drop interactions become progressively more important. However, it should be noted that the general relation for effective stresses involves individual drop contributions:
Here,
![]() $\unicode[STIX]{x1D61A}_{ij}$
is the traceless stresslet tensor and
$\unicode[STIX]{x1D61A}_{ij}$
is the traceless stresslet tensor and
![]() $\bar{\unicode[STIX]{x1D61A}}_{ij}$
is the stresslet averaged over all of the drops. Drop–drop interactions modify the individual drop contributions. To understand the effects of interactions on the emulsion rheology, we note that following (Batchelor & Green Reference Batchelor and Green1972), the average stresslet can be written as
$\bar{\unicode[STIX]{x1D61A}}_{ij}$
is the stresslet averaged over all of the drops. Drop–drop interactions modify the individual drop contributions. To understand the effects of interactions on the emulsion rheology, we note that following (Batchelor & Green Reference Batchelor and Green1972), the average stresslet can be written as
The first term in the right-hand side is the single-drop stresslet under the given hydrodynamic conditions and does not include the effects of interdrop interactions. The second term represents the additional contribution to the stresslet
![]() $\unicode[STIX]{x0394}\unicode[STIX]{x1D61A}_{ij}$
due to interactions for a particular relative configuration
$\unicode[STIX]{x0394}\unicode[STIX]{x1D61A}_{ij}$
due to interactions for a particular relative configuration
![]() $X$
with probability
$X$
with probability
![]() $P(X)$
; this term is averaged over all possible relative configurations. This term can be approximated by only considering the probability of two drops closely interacting in their shear plane using the pair-distribution function at contact. The pair-distribution function
$P(X)$
; this term is averaged over all possible relative configurations. This term can be approximated by only considering the probability of two drops closely interacting in their shear plane using the pair-distribution function at contact. The pair-distribution function
![]() $g(\boldsymbol{r})$
, the probability of finding a second particle at a relative distance
$g(\boldsymbol{r})$
, the probability of finding a second particle at a relative distance
![]() $\boldsymbol{r}$
from any particle, has been extensively analysed in suspension rheology (Phung et al.
Reference Phung, Brady and Bossis1996; Brady & Morris Reference Brady and Morris1997; Morris & Katyal Reference Morris and Katyal2002; Clausen et al.
Reference Clausen, Reasor and Aidun2011). Specifically, its value at contact, i.e. for two particles nearly touching each other, as a function of the orientation of the particle pair is used to explain the observed non-Newtonian behaviour of rigid sphere suspensions.
$\boldsymbol{r}$
from any particle, has been extensively analysed in suspension rheology (Phung et al.
Reference Phung, Brady and Bossis1996; Brady & Morris Reference Brady and Morris1997; Morris & Katyal Reference Morris and Katyal2002; Clausen et al.
Reference Clausen, Reasor and Aidun2011). Specifically, its value at contact, i.e. for two particles nearly touching each other, as a function of the orientation of the particle pair is used to explain the observed non-Newtonian behaviour of rigid sphere suspensions.
Figure 12(a,b) plots the pair-distribution probability as a function of the azimuthal angle of a drop in the shear plane – from the direction of approach of a second drop (near
![]() $180^{\circ }$
), through the compression quadrant, to where the second drop separates away (near
$180^{\circ }$
), through the compression quadrant, to where the second drop separates away (near
![]() $0^{\circ }$
). For deformable drops, the contact pair-distribution function is defined here by limiting the distances between two drops to the range of
$0^{\circ }$
). For deformable drops, the contact pair-distribution function is defined here by limiting the distances between two drops to the range of
![]() $1.5a{-}2.4a$
(
$1.5a{-}2.4a$
(
![]() $a$
is the drop radius). The probability is highest in the compression quadrant and near zero away in the extension quadrant especially during separation. During the time when drops are pressed in the compression quadrant, their deformation increases (Loewenberg & Hinch Reference Loewenberg and Hinch1997; Olapade, Singh & Sarkar Reference Olapade, Singh and Sarkar2009; Singh & Sarkar Reference Singh and Sarkar2009), increasing the stresslet contribution. Figure 12(a) plots the pair-distribution probability for one capillary number,
$a$
is the drop radius). The probability is highest in the compression quadrant and near zero away in the extension quadrant especially during separation. During the time when drops are pressed in the compression quadrant, their deformation increases (Loewenberg & Hinch Reference Loewenberg and Hinch1997; Olapade, Singh & Sarkar Reference Olapade, Singh and Sarkar2009; Singh & Sarkar Reference Singh and Sarkar2009), increasing the stresslet contribution. Figure 12(a) plots the pair-distribution probability for one capillary number,
![]() $Ca=0.05$
, and different
$Ca=0.05$
, and different
![]() $Re$
values, while figure 12(b) plots it for one
$Re$
values, while figure 12(b) plots it for one
![]() $Re$
but three Ca values. To understand the interaction phenomenon better, we simulate the dynamics of two drops in a shear. In figure 12(c), we plot the contributions to the interfacial stresses
$Re$
but three Ca values. To understand the interaction phenomenon better, we simulate the dynamics of two drops in a shear. In figure 12(c), we plot the contributions to the interfacial stresses
![]() $N_{1}^{int}$
and
$N_{1}^{int}$
and
![]() $N_{2}^{int}$
due to one of them as well as the azimuthal angle between the drops as functions of time. As noted above, the angle is closer to
$N_{2}^{int}$
due to one of them as well as the azimuthal angle between the drops as functions of time. As noted above, the angle is closer to
![]() $180^{\circ }$
as the drops approach each other and
$180^{\circ }$
as the drops approach each other and
![]() $0^{\circ }$
as they separate. The effects on the normal stress differences (increasing for
$0^{\circ }$
as they separate. The effects on the normal stress differences (increasing for
![]() $N_{1}^{int}$
and decreasing for
$N_{1}^{int}$
and decreasing for
![]() $N_{2}^{int}$
) are highest when the drops approach each other, and the opposite happens during separation. However, from the contact pair-distribution function (figure 12
a), we noted already that the probability is much higher in the compression quadrant. With increasing capillary number the peak value of the probability density in this quadrant decreases (figure 12
b). The increase of
$N_{2}^{int}$
) are highest when the drops approach each other, and the opposite happens during separation. However, from the contact pair-distribution function (figure 12
a), we noted already that the probability is much higher in the compression quadrant. With increasing capillary number the peak value of the probability density in this quadrant decreases (figure 12
b). The increase of
![]() $N_{1}^{int}$
and decrease of
$N_{1}^{int}$
and decrease of
![]() $N_{2}^{int}$
with volume fraction
$N_{2}^{int}$
with volume fraction
![]() $\unicode[STIX]{x1D719}$
can now be understood as resulting from increased probability of contact interactions between drops; the individual droplet stresslet contribution increases during close encounter in the compression quadrant. In figure 12(a), it can be noted that with increasing
$\unicode[STIX]{x1D719}$
can now be understood as resulting from increased probability of contact interactions between drops; the individual droplet stresslet contribution increases during close encounter in the compression quadrant. In figure 12(a), it can be noted that with increasing
![]() $Re$
, the zero probability region moves closer to the extension axis, as was also observed for a rigid sphere suspension (Kulkarni & Morris Reference Kulkarni and Morris2008). However, that simulation for a rigid sphere suspension showed an increase in pair probability at
$Re$
, the zero probability region moves closer to the extension axis, as was also observed for a rigid sphere suspension (Kulkarni & Morris Reference Kulkarni and Morris2008). However, that simulation for a rigid sphere suspension showed an increase in pair probability at
![]() $0^{\circ }$
with increasing
$0^{\circ }$
with increasing
![]() $Re$
, indicating that spheres tend to line up along the flow direction. In contrast, here we see a decrease in the corresponding probability at
$Re$
, indicating that spheres tend to line up along the flow direction. In contrast, here we see a decrease in the corresponding probability at
![]() $0^{\circ }$
with increasing
$0^{\circ }$
with increasing
![]() $Re$
.
$Re$
.
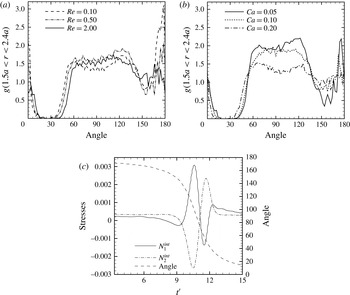
Figure 12. Pair distributions as a function of different relative orientations in the shear plane at
![]() $\unicode[STIX]{x1D719}=20\,\%$
(a) for different
$\unicode[STIX]{x1D719}=20\,\%$
(a) for different
![]() $Re$
and
$Re$
and
![]() $Ca=0.05$
and (b) for different
$Ca=0.05$
and (b) for different
![]() $Ca$
and
$Ca$
and
![]() $Re=1.0$
. (c) Time evolution of interfacial stresses (non-dimensionalized by
$Re=1.0$
. (c) Time evolution of interfacial stresses (non-dimensionalized by
![]() $\unicode[STIX]{x1D707}\dot{\unicode[STIX]{x1D6FE}}$
) arising from a single drop during pair interactions at
$\unicode[STIX]{x1D707}\dot{\unicode[STIX]{x1D6FE}}$
) arising from a single drop during pair interactions at
![]() $Re=1.0$
and
$Re=1.0$
and
![]() $Ca=0.05$
.
$Ca=0.05$
.
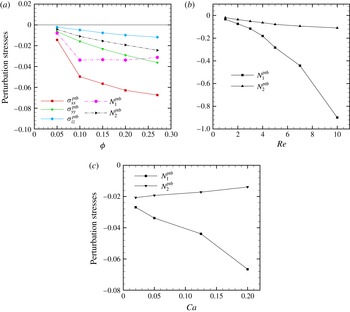
Figure 13. (a) Variation of the perturbation stresses (non-dimensionalized by
![]() $\unicode[STIX]{x1D707}\dot{\unicode[STIX]{x1D6FE}}$
) with the volume fraction at
$\unicode[STIX]{x1D707}\dot{\unicode[STIX]{x1D6FE}}$
) with the volume fraction at
![]() $Re=1.0$
and
$Re=1.0$
and
![]() $Ca=0.05$
. At a fixed volume fraction
$Ca=0.05$
. At a fixed volume fraction
![]() $\unicode[STIX]{x1D719}=20\,\%$
, variation of the perturbation stress differences with
$\unicode[STIX]{x1D719}=20\,\%$
, variation of the perturbation stress differences with
![]() $Re$
at
$Re$
at
![]() $Ca=0.05$
(b), and with
$Ca=0.05$
(b), and with
![]() $Ca$
at
$Ca$
at
![]() $Re=1.0$
(c).
$Re=1.0$
(c).
3.7 Perturbation stresses $\unicode[STIX]{x1D748}^{ptb}$
Figure 13 shows the variation of the perturbation stress with various parameters. Three components,
![]() $\unicode[STIX]{x1D748}_{xx}^{ptb},\unicode[STIX]{x1D748}_{yy}^{ptb}$
and
$\unicode[STIX]{x1D748}_{xx}^{ptb},\unicode[STIX]{x1D748}_{yy}^{ptb}$
and
![]() $\unicode[STIX]{x1D748}_{zz}^{ptb}$
, are plotted in figure 13(a) as functions of the volume fraction for
$\unicode[STIX]{x1D748}_{zz}^{ptb}$
, are plotted in figure 13(a) as functions of the volume fraction for
![]() $Ca=0.05$
and
$Ca=0.05$
and
![]() $Re=1.0$
. The cross-components
$Re=1.0$
. The cross-components
![]() $\unicode[STIX]{x1D748}_{xy}^{ptb}$
,
$\unicode[STIX]{x1D748}_{xy}^{ptb}$
,
![]() $\unicode[STIX]{x1D748}_{zy}^{ptb}$
and
$\unicode[STIX]{x1D748}_{zy}^{ptb}$
and
![]() $\unicode[STIX]{x1D748}_{xz}^{ptb}$
are relatively small quantities and they do not affect the total stresses. They are therefore not plotted. The components
$\unicode[STIX]{x1D748}_{xz}^{ptb}$
are relatively small quantities and they do not affect the total stresses. They are therefore not plotted. The components
![]() $\unicode[STIX]{x1D748}_{yy}^{ptb}$
and
$\unicode[STIX]{x1D748}_{yy}^{ptb}$
and
![]() $\unicode[STIX]{x1D748}_{zz}^{ptb}$
show a roughly linear dependence with volume fraction, and if the curves are extrapolated they will become zero at diminishing volume fraction. However,
$\unicode[STIX]{x1D748}_{zz}^{ptb}$
show a roughly linear dependence with volume fraction, and if the curves are extrapolated they will become zero at diminishing volume fraction. However,
![]() $\unicode[STIX]{x1D748}_{xx}^{ptb}$
shows a nonlinear dependence, as is evident from the fact that the curve has to pass through the origin. The same plot also shows the dependence of
$\unicode[STIX]{x1D748}_{xx}^{ptb}$
shows a nonlinear dependence, as is evident from the fact that the curve has to pass through the origin. The same plot also shows the dependence of
![]() $N_{1}^{ptb}$
and
$N_{1}^{ptb}$
and
![]() $N_{2}^{ptb}$
on the volume fraction. It should be noted that with increasing volume fraction the magnitude of these perturbative normal stresses increases. Figure 13(b) shows the dependence of the perturbative normal stress differences with the Reynolds number at
$N_{2}^{ptb}$
on the volume fraction. It should be noted that with increasing volume fraction the magnitude of these perturbative normal stresses increases. Figure 13(b) shows the dependence of the perturbative normal stress differences with the Reynolds number at
![]() $Ca=0.05$
at a fixed volume fraction of 20 %. It further shows that the perturbative normal stresses, although small in comparison to the interfacial stresses for small
$Ca=0.05$
at a fixed volume fraction of 20 %. It further shows that the perturbative normal stresses, although small in comparison to the interfacial stresses for small
![]() $Re$
(
$Re$
(
![]() $Re<1.0$
), increase in magnitude sharply with increasing Reynolds number, making them eventually the dominant contribution in the total excess stress. Comparing with the interfacial contribution described in the previous subsection, we can note that the perturbative stresses become comparable to it at large Reynolds numbers for larger volume fractions –
$Re<1.0$
), increase in magnitude sharply with increasing Reynolds number, making them eventually the dominant contribution in the total excess stress. Comparing with the interfacial contribution described in the previous subsection, we can note that the perturbative stresses become comparable to it at large Reynolds numbers for larger volume fractions –
![]() $Re\sim 1$
for
$Re\sim 1$
for
![]() $\unicode[STIX]{x1D719}=10\,\%$
,
$\unicode[STIX]{x1D719}=10\,\%$
,
![]() $Re\sim 2$
for
$Re\sim 2$
for
![]() $\unicode[STIX]{x1D719}=20\,\%$
and
$\unicode[STIX]{x1D719}=20\,\%$
and
![]() $Re\sim 4$
for
$Re\sim 4$
for
![]() $\unicode[STIX]{x1D719}=27\,\%$
. While
$\unicode[STIX]{x1D719}=27\,\%$
. While
![]() $N_{2}^{ptb}$
varies approximately linearly with
$N_{2}^{ptb}$
varies approximately linearly with
![]() $Re$
,
$Re$
,
![]() $N_{1}^{ptb}$
shows a weak nonlinear decrease with
$N_{1}^{ptb}$
shows a weak nonlinear decrease with
![]() $Re$
for larger
$Re$
for larger
![]() $Re$
values, as was also observed by Li & Sarkar (Reference Li and Sarkar2005b
) for dilute simulations. As the curves indicate, the perturbation stresses should vanish at zero
$Re$
values, as was also observed by Li & Sarkar (Reference Li and Sarkar2005b
) for dilute simulations. As the curves indicate, the perturbation stresses should vanish at zero
![]() $Re$
. The linear scaling of the perturbation stress differences with Reynolds number (at least for the low Reynolds numbers) can be explained by noting that
$Re$
. The linear scaling of the perturbation stress differences with Reynolds number (at least for the low Reynolds numbers) can be explained by noting that
![]() $\boldsymbol{u}^{\prime }\sim \dot{\unicode[STIX]{x1D6FE}}a$
and the stresses are scaled by
$\boldsymbol{u}^{\prime }\sim \dot{\unicode[STIX]{x1D6FE}}a$
and the stresses are scaled by
![]() $\unicode[STIX]{x1D707}\dot{\unicode[STIX]{x1D6FE}}$
, leading to
$\unicode[STIX]{x1D707}\dot{\unicode[STIX]{x1D6FE}}$
, leading to
![]() $\unicode[STIX]{x1D748}^{ptb}/\unicode[STIX]{x1D707}\dot{\unicode[STIX]{x1D6FE}}\sim Re\int _{V}\unicode[STIX]{x1D70C}\boldsymbol{u}^{\prime }\boldsymbol{u}^{\prime }\,\text{d}V$
.
$\unicode[STIX]{x1D748}^{ptb}/\unicode[STIX]{x1D707}\dot{\unicode[STIX]{x1D6FE}}\sim Re\int _{V}\unicode[STIX]{x1D70C}\boldsymbol{u}^{\prime }\boldsymbol{u}^{\prime }\,\text{d}V$
.
Figure 13(c) shows the variation of the perturbation stress differences with the capillary number at a fixed Reynolds number of
![]() $Re=1.0$
and volume fraction of
$Re=1.0$
and volume fraction of
![]() $\unicode[STIX]{x1D719}=0.20$
. Here,
$\unicode[STIX]{x1D719}=0.20$
. Here,
![]() $N_{1}^{ptb}$
shows a steep decrease with the capillary number. This is due to a steep decrease in
$N_{1}^{ptb}$
shows a steep decrease with the capillary number. This is due to a steep decrease in
![]() $\unicode[STIX]{x1D748}_{xx}^{ptb}$
with Ca which is arising due to increase in the disturbances along the
$\unicode[STIX]{x1D748}_{xx}^{ptb}$
with Ca which is arising due to increase in the disturbances along the
![]() $x$
direction (flow direction). This can be explained by the fact that increasing capillary number orients and deforms the drops more along the
$x$
direction (flow direction). This can be explained by the fact that increasing capillary number orients and deforms the drops more along the
![]() $x$
-direction which in turn increases the disturbances along that axis.
$x$
-direction which in turn increases the disturbances along that axis.
3.8 Total excess stresses
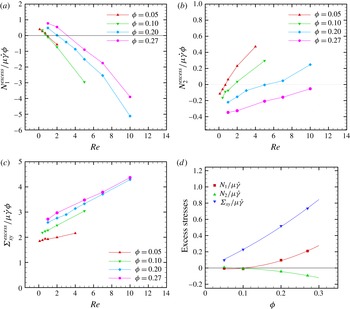
Figure 14. Excess stresses with
![]() $Re$
for different volume fractions at
$Re$
for different volume fractions at
![]() $Ca=0.05$
: (a)
$Ca=0.05$
: (a)
![]() $N_{1}^{excess}$
, (b)
$N_{1}^{excess}$
, (b)
![]() $N_{2}^{excess}$
and (c)
$N_{2}^{excess}$
and (c)
![]() $\unicode[STIX]{x1D6F4}_{xy}^{excess}$
. (d) Excess stresses versus
$\unicode[STIX]{x1D6F4}_{xy}^{excess}$
. (d) Excess stresses versus
![]() $\unicode[STIX]{x1D719}$
along with a fit at
$\unicode[STIX]{x1D719}$
along with a fit at
![]() $Re=1.0$
and
$Re=1.0$
and
![]() $Ca=0.05$
.
$Ca=0.05$
.
The total effective stress characterizing the bulk properties of the emulsion contains the excess stress due to the presence of the dispersed phase. According to equation (2.3), for a viscosity-matched system such as the one considered here, the excess stress
![]() $\unicode[STIX]{x1D748}^{excess}$
consists of the interface contribution
$\unicode[STIX]{x1D748}^{excess}$
consists of the interface contribution
![]() $\unicode[STIX]{x1D748}^{int}$
and the perturbation stress
$\unicode[STIX]{x1D748}^{int}$
and the perturbation stress
![]() $\unicode[STIX]{x1D748}^{ptb}$
individually discussed in the previous sections. Figure 14(a–c) plots the excess stresses as functions of the Reynolds number for different volume fractions at
$\unicode[STIX]{x1D748}^{ptb}$
individually discussed in the previous sections. Figure 14(a–c) plots the excess stresses as functions of the Reynolds number for different volume fractions at
![]() $Ca=0.05$
. Because of the dominance of the interfacial contributions in the low-
$Ca=0.05$
. Because of the dominance of the interfacial contributions in the low-
![]() $Re$
region, the excess stresses show the same qualitative behaviour as the interfacial stresses in this range. The perturbative stresses make a negative contribution and the excess first normal stress difference remains negative for most
$Re$
region, the excess stresses show the same qualitative behaviour as the interfacial stresses in this range. The perturbative stresses make a negative contribution and the excess first normal stress difference remains negative for most
![]() $Re$
values. Its variation with
$Re$
values. Its variation with
![]() $Re$
is steeper than that of the interfacial counterpart because of the large value of the perturbative contribution at
$Re$
is steeper than that of the interfacial counterpart because of the large value of the perturbative contribution at
![]() $Re>1.0$
. On the other hand, the interfacial second normal stress difference is largely positive. A negative contribution of the perturbative stress makes the curve of the excess second normal stress difference flatter. Compared with the interfacial shear stress the perturbative stress is much smaller in magnitude and therefore the excess shear stress remains almost the same. As noted before, even after scaling by the volume fraction
$Re>1.0$
. On the other hand, the interfacial second normal stress difference is largely positive. A negative contribution of the perturbative stress makes the curve of the excess second normal stress difference flatter. Compared with the interfacial shear stress the perturbative stress is much smaller in magnitude and therefore the excess shear stress remains almost the same. As noted before, even after scaling by the volume fraction
![]() $\unicode[STIX]{x1D719}$
, the excess stresses for different values of
$\unicode[STIX]{x1D719}$
, the excess stresses for different values of
![]() $\unicode[STIX]{x1D719}$
do not collapse, indicating a nonlinear dependence. Figure 14(d) plots the excess stresses as a function of the volume fraction along with an approximate quadratic fit:
$\unicode[STIX]{x1D719}$
do not collapse, indicating a nonlinear dependence. Figure 14(d) plots the excess stresses as a function of the volume fraction along with an approximate quadratic fit:
 $$\begin{eqnarray}\left.\begin{array}{@{}c@{}}\displaystyle N_{1}^{excess}/\unicode[STIX]{x1D707}\dot{\unicode[STIX]{x1D6FE}}=\unicode[STIX]{x1D719}(-0.4815+4.681\unicode[STIX]{x1D719}),\\ \displaystyle N_{2}^{excess}/\unicode[STIX]{x1D707}\dot{\unicode[STIX]{x1D6FE}}=\unicode[STIX]{x1D719}(0.1396-1.805\unicode[STIX]{x1D719}),\\ \displaystyle \unicode[STIX]{x1D6F4}_{xy}^{excess}/\unicode[STIX]{x1D707}\dot{\unicode[STIX]{x1D6FE}}=\unicode[STIX]{x1D719}(2.01+2.687\unicode[STIX]{x1D719}).\end{array}\right\}\end{eqnarray}$$
In figure 15(a–c), we plot the excess first and second normal stress differences as well as the shear stress as functions of the Reynolds number for different capillary numbers. Figures 14(a–c) and 15(a–c) show approximately linear dependence with
![]() $Re$
at least for the smaller range of
$Re$
at least for the smaller range of
![]() $0.1\leqslant Re\leqslant 5$
. In figure 15(d), we show that the excess stresses approximately follow a quadratic variation with capillary number:
$0.1\leqslant Re\leqslant 5$
. In figure 15(d), we show that the excess stresses approximately follow a quadratic variation with capillary number:
 $$\begin{eqnarray}\left.\begin{array}{@{}l@{}}\displaystyle N_{1}^{excess}/\unicode[STIX]{x1D707}\dot{\unicode[STIX]{x1D6FE}}=-0.0448+3.008Ca-2.764Ca^{2},\\ \displaystyle N_{2}^{excess}/\unicode[STIX]{x1D707}\dot{\unicode[STIX]{x1D6FE}}=-0.1055-0.9591Ca+1.414Ca^{2},\\ \displaystyle \unicode[STIX]{x1D6F4}_{xy}^{excess}/\unicode[STIX]{x1D707}\dot{\unicode[STIX]{x1D6FE}}=0.6044-1.615Ca+3.113Ca^{2}.\end{array}\right\}\end{eqnarray}$$
It should be noted that the viscoelastic stresses (e.g. the first normal stress difference) arising from deforming drops are quite comparable to the viscous stresses at higher Ca values (
![]() $Ca\sim 0.2$
), as can be seen in figure 15(d). By direct numerical simulation, as used here, one can develop useful general phenomenological correlations between the effective rheological stresses and the relevant non-dimensional parameters. However, robust accurate correlations in the entire range of capillary number, Reynolds number and volume fraction require extensive numerical simulations varying all three parameters. The primary goal of this paper is to elucidate the underlying physics of the excess stress, and therefore such a computational endeavour remains outside the scope of this paper. Finally, to elucidate the effect of the sign change of the normal stress differences, we note that a positive
$Ca\sim 0.2$
), as can be seen in figure 15(d). By direct numerical simulation, as used here, one can develop useful general phenomenological correlations between the effective rheological stresses and the relevant non-dimensional parameters. However, robust accurate correlations in the entire range of capillary number, Reynolds number and volume fraction require extensive numerical simulations varying all three parameters. The primary goal of this paper is to elucidate the underlying physics of the excess stress, and therefore such a computational endeavour remains outside the scope of this paper. Finally, to elucidate the effect of the sign change of the normal stress differences, we note that a positive
![]() $N_{1}$
in a polymeric flow exerts a compressive stress on the bottom plate while being sheared in a cone and plate rheometer in a Stokes flow, in contrast to zero force for a Newtonian fluid. The inertia induced sign change demonstrated in this paper (figures 14 and 15) indicates that even a small amount of inertia (drop Reynolds number 2–5) is sufficient to change the physics, giving rise to tensile force on the bottom plate.
$N_{1}$
in a polymeric flow exerts a compressive stress on the bottom plate while being sheared in a cone and plate rheometer in a Stokes flow, in contrast to zero force for a Newtonian fluid. The inertia induced sign change demonstrated in this paper (figures 14 and 15) indicates that even a small amount of inertia (drop Reynolds number 2–5) is sufficient to change the physics, giving rise to tensile force on the bottom plate.
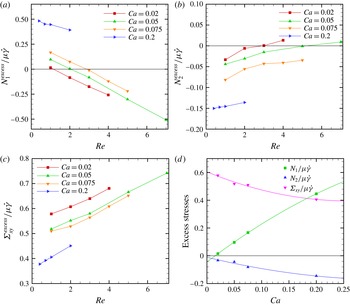
Figure 15. Excess stresses with
![]() $Re$
for different capillary numbers at
$Re$
for different capillary numbers at
![]() $\unicode[STIX]{x1D719}=20\,\%$
: (a)
$\unicode[STIX]{x1D719}=20\,\%$
: (a)
![]() $N_{1}^{excess}$
, (b)
$N_{1}^{excess}$
, (b)
![]() $N_{2}^{excess}$
and (c)
$N_{2}^{excess}$
and (c)
![]() $\unicode[STIX]{x1D6F4}_{xy}^{excess}$
. (d) Excess stresses versus
$\unicode[STIX]{x1D6F4}_{xy}^{excess}$
. (d) Excess stresses versus
![]() $Ca$
along with a fit at
$Ca$
along with a fit at
![]() $Re=1.0$
and
$Re=1.0$
and
![]() $\unicode[STIX]{x1D719}=20\,\%$
.
$\unicode[STIX]{x1D719}=20\,\%$
.
4 Summary and conclusion
Dense emulsions of viscous drops in plane shear are simulated using direct numerical simulation in the presence of finite inertia, and the effective rheology of such emulsions is computed. Previously, we have shown that finite inertia can induce a sign change of the effective first and second normal stress differences. The results were obtained in the dilute limit, where drop–drop interactions were ignored – the results were purely based on a single-drop simulation. Here, the same phenomenon is investigated by simulating an equiviscous multidrop system and extended to dense emulsion – with volume fraction up to 27 %.
The Batchelor formulation is used for the stress computation, which indicates two distinct components for the viscosity-matched system considered here – purely geometric interfacial stresses determined by the drop shapes and perturbative Reynolds type stresses due to inertia. Both components are investigated, varying the volume fraction, capillary number and Reynolds number. Previously, in the dilute limit (Li & Sarkar Reference Li and Sarkar2005b
), we found that the interfacial stresses dominate over the perturbative component at small Reynolds number. Here, we find that the magnitude of the perturbative stresses increases with the volume fraction and even more sharply with the Reynolds number, eventually making it the dominant contribution at higher
![]() $Re$
values. Our results compare well with those obtained by Stokes flow boundary element simulation (except for small differences at low capillary numbers with Zinchenko & Davis (Reference Zinchenko and Davis2002)) and an experimentally obtained empirical relation for effective viscosity as a function of volume fraction. In the dilute limit, we recover the single-drop result obtained earlier. The sign change at finite inertia stems from drops getting aligned at more than
$Re$
values. Our results compare well with those obtained by Stokes flow boundary element simulation (except for small differences at low capillary numbers with Zinchenko & Davis (Reference Zinchenko and Davis2002)) and an experimentally obtained empirical relation for effective viscosity as a function of volume fraction. In the dilute limit, we recover the single-drop result obtained earlier. The sign change at finite inertia stems from drops getting aligned at more than
![]() $45^{\circ }$
with the flow direction. A physical explanation is provided as to how this causes a decrease (increase) in the interfacial first (second) normal stress difference with increasing Reynolds number, eventually making it negative (positive). The increasing inclination angle and drop deformation are also shown to cause the observed increase in effective shear stress. In a dense emulsion, the drop–drop interactions cause the drops to align more with the flow, lessening the above effects. With increasing capillary number, the interfacial first normal stress difference increases but the second normal stress difference and shear stress decrease due to increased drop deformation and enhanced drop alignment with the flow.
$45^{\circ }$
with the flow direction. A physical explanation is provided as to how this causes a decrease (increase) in the interfacial first (second) normal stress difference with increasing Reynolds number, eventually making it negative (positive). The increasing inclination angle and drop deformation are also shown to cause the observed increase in effective shear stress. In a dense emulsion, the drop–drop interactions cause the drops to align more with the flow, lessening the above effects. With increasing capillary number, the interfacial first normal stress difference increases but the second normal stress difference and shear stress decrease due to increased drop deformation and enhanced drop alignment with the flow.
Unlike the dilute emulsion result, the effective stresses are not linear in the volume fraction. The effects of drop–drop interactions are investigated by examining the contact pair-distribution function, which experiences an increase when the drops are interacting in the compression quadrant. The close interaction causes a sharp increase in the drop contributions to the interfacial normal stress differences – positive for the first and negative for the second – delaying the sign change to higher Reynolds numbers. The perturbative Reynolds stresses show linear decrease with Reynolds number for small Reynolds numbers – the approximate linear scaling can be explained on dimensional grounds. With increasing capillary number, the perturbative first normal stress shows a steep decrease due to increased deformation and flow alignment. The excess stresses also show approximately linear scaling with the Reynolds number at least for the low-Reynolds-number range
![]() $0.1\leqslant Re\leqslant 5$
. A quadratic fit of the excess stresses with the volume fraction
$0.1\leqslant Re\leqslant 5$
. A quadratic fit of the excess stresses with the volume fraction
![]() $\unicode[STIX]{x1D719}$
is obtained in the range considered.
$\unicode[STIX]{x1D719}$
is obtained in the range considered.
Acknowledgements
This work is partially supported by NSF grants no. CBET-1205322, DMR-1239105. The authors acknowledge H. Haddadi who graciously shared his code for computation of the pair-distribution function.


